

TREND Multi-TF Confluence
This indicator evaluates trend strength across three timeframes simultaneously, combining five Simple Moving Averages with the Accelerator Oscillator by Bill Williams. Instead of a static dashboard, it plots three colored lines in a separate panel — one per timeframe — giving you a visual history of how multi-timeframe confluence evolves over time.
How it works
The indicator runs the same analysis on each of the three timeframes (default: 15 minutes, 1 hour, 4 hours).
Moving Average direction — Five SMAs with Fibonacci periods (5, 8, 13, 21, 34) are calculated on each timeframe. For each SMA, the indicator checks whether its current value is above, below, or equal to its previous value. A rising SMA scores +1, a falling SMA scores -1, and a flat SMA scores 0.
Accelerator Oscillator direction — The AC is computed manually as follows: the Awesome Oscillator (AO) equals SMA(5) minus SMA(34) of the Median Price, and then AC equals AO minus SMA(5) of the AO itself. The AC direction is determined by checking for sustained momentum shifts — consecutive rising or falling bars combined with sign changes. A bullish AC scores +3 and a bearish AC scores -3, giving it triple the weight of any single SMA.
Scoring — The bullish and bearish points are summed separately and multiplied by 12.5 to produce a percentage from 0% to 100% for each side. The net score (bullish minus bearish) ranges from -100 to +100 per timeframe and is what gets plotted as the line.
Reading the indicator
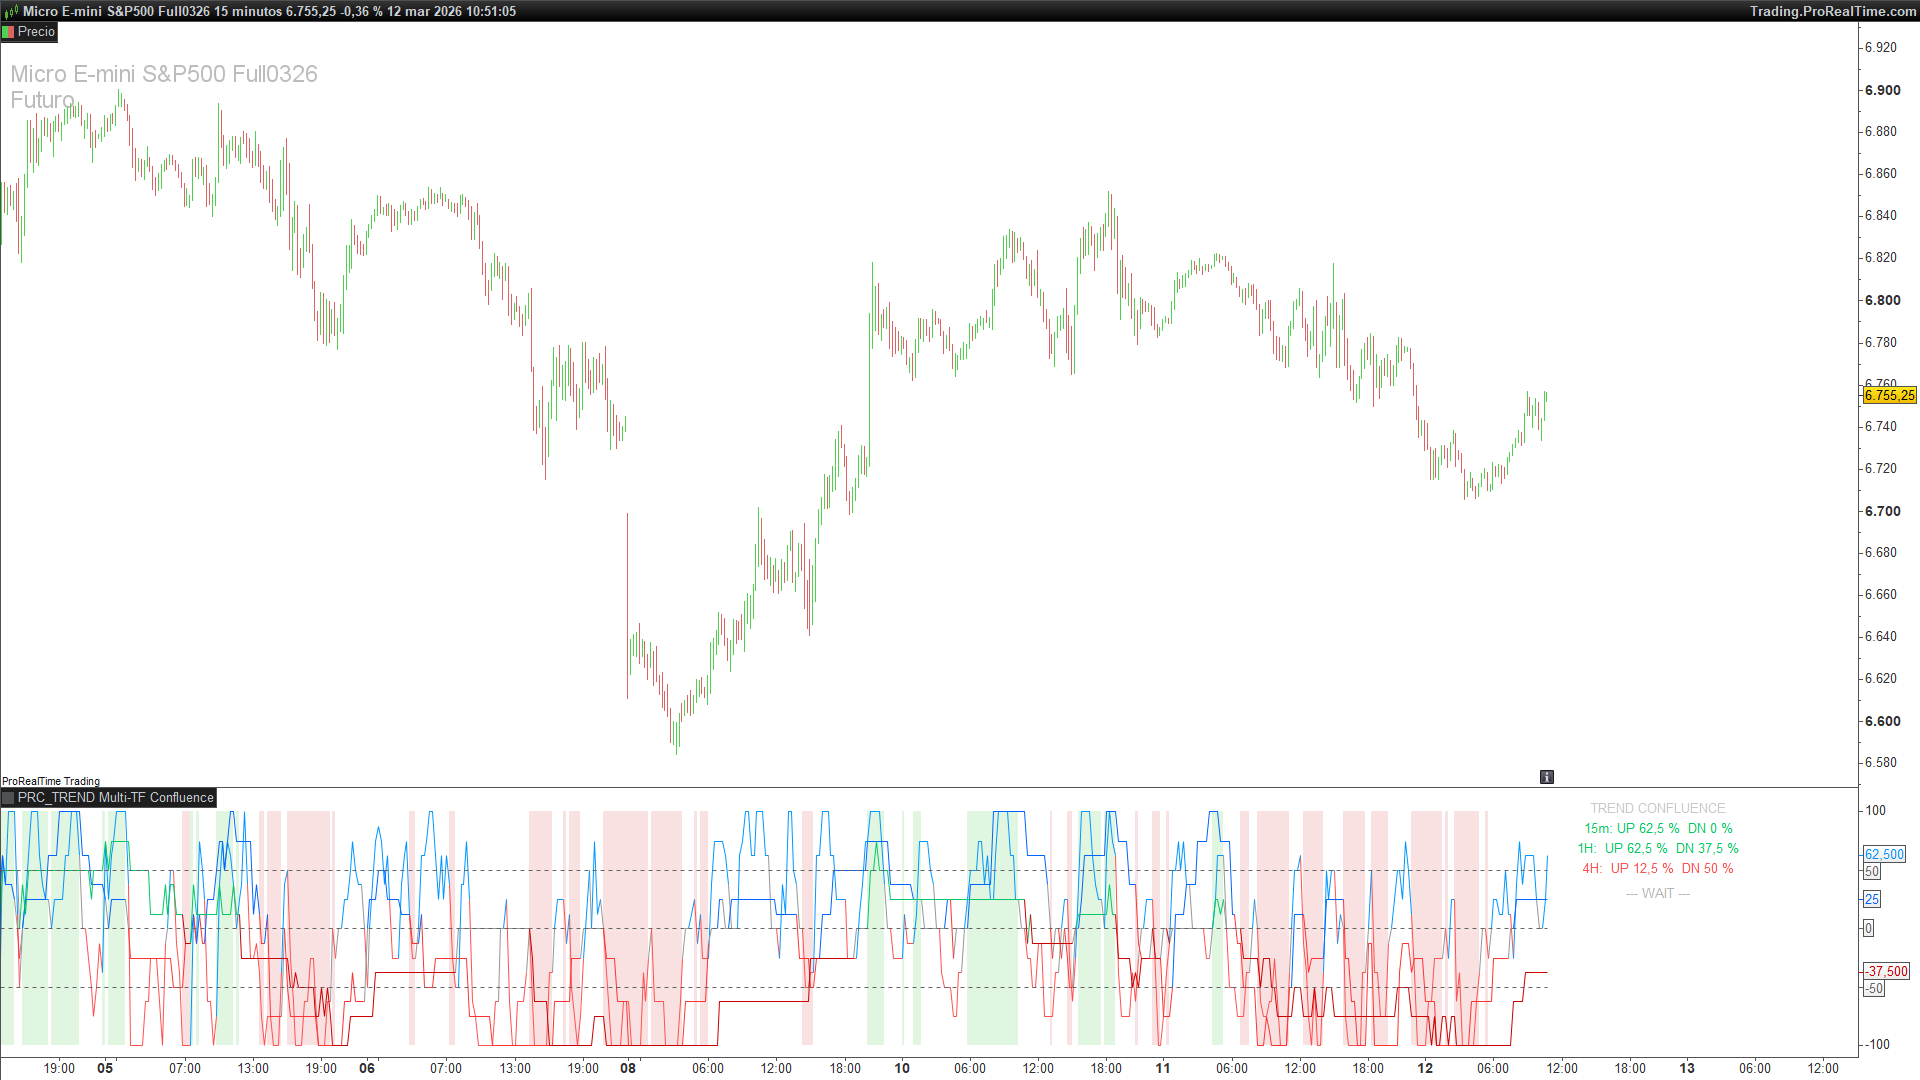
The three lines represent the net score for each timeframe. When a line is positive, the corresponding timeframe leans bullish. When negative, bearish. The further from zero, the stronger the consensus among the SMAs and the Accelerator Oscillator.
Line colors change dynamically — blue tones when positive, red tones when negative, gray when neutral. Each timeframe uses a slightly different shade so they remain distinguishable when they overlap.
Background shading highlights full confluence zones. A green tint fills the panel when all three timeframes are positive simultaneously. A red tint appears when all three are negative. No shading means the timeframes disagree.
The info panel is anchored to the top-right corner and displays four rows. The first three rows show each timeframe with its bullish and bearish percentages (e.g. “15m: UP 62.5% DN 37.5%”), colored green, red, or gray according to the net direction. The fourth row shows the overall signal.
Signal logic follows these rules: if all three timeframes show a bullish score above 50%, the signal is BUY. If all three exceed 75%, it upgrades to GOOD BUY. The same applies on the bearish side for SELL and GOOD SELL. If none of these conditions are met, the signal reads WAIT.
Settings
Timeframes are hardcoded at 15 minutes, 1 hour, and 4 hours. To change them, edit the three TIMEFRAME() blocks in the code.
Remember that ProRealTime requires the chart’s base timeframe to be smaller than the lowest timeframe used in the indicator — so if you keep the 15-minute block, apply the indicator on a chart of 10 minutes or less.
SMA periods are set to 5, 8, 13, 21, and 34 (Fibonacci sequence). You can modify these directly in the code by changing the values inside each average[N](close) call.
Accelerator Oscillator periods use the standard Bill Williams parameters: SMA(5) and SMA(34) of Median Price for the AO, and SMA(5) of the AO for the AC.
Code
//--------------------------------------------------
// PRC_TREND Multi-TF Confluence
// Original: TREND_alexcud v2 (Aleksander Kudimov, 2007)
// version = 0
// 12.03.2026
// Iván González @ www.prorealcode.com
// Sharing ProRealTime knowledge
//--------------------------------------------------
defparam drawonlastbaronly = true
//--------------------------------------------------
// TIMEFRAME 1: 15 MINUTOS
//--------------------------------------------------
TIMEFRAME(15 minutes)
IF average[5](close) > average[5](close)[1] THEN
d1t1 = 1
ELSIF average[5](close) < average[5](close)[1] THEN
d1t1 = -1
ELSE
d1t1 = 0
ENDIF
IF average[8](close) > average[8](close)[1] THEN
d2t1 = 1
ELSIF average[8](close) < average[8](close)[1] THEN
d2t1 = -1
ELSE
d2t1 = 0
ENDIF
IF average[13](close) > average[13](close)[1] THEN
d3t1 = 1
ELSIF average[13](close) < average[13](close)[1] THEN
d3t1 = -1
ELSE
d3t1 = 0
ENDIF
IF average[21](close) > average[21](close)[1] THEN
d4t1 = 1
ELSIF average[21](close) < average[21](close)[1] THEN
d4t1 = -1
ELSE
d4t1 = 0
ENDIF
IF average[34](close) > average[34](close)[1] THEN
d5t1 = 1
ELSIF average[34](close) < average[34](close)[1] THEN
d5t1 = -1
ELSE
d5t1 = 0
ENDIF
aoTF1 = average[5](MedianPrice) - average[34](MedianPrice)
acTF1 = aoTF1 - average[5](aoTF1)
IF (acTF1[1] > acTF1[2] AND acTF1[2] > acTF1[3] AND acTF1 < 0 AND acTF1 > acTF1[1]) OR (acTF1 > acTF1[1] AND acTF1[1] > acTF1[2] AND acTF1 > 0) THEN
dAcT1 = 3
ELSIF (acTF1[1] < acTF1[2] AND acTF1[2] < acTF1[3] AND acTF1 > 0 AND acTF1 < acTF1[1]) OR (acTF1 < acTF1[1] AND acTF1[1] < acTF1[2] AND acTF1 < 0) THEN
dAcT1 = -3
ELSE
dAcT1 = 0
ENDIF
upTF1 = (MAX(0, d1t1) + MAX(0, d2t1) + MAX(0, d3t1) + MAX(0, d4t1) + MAX(0, d5t1) + MAX(0, dAcT1)) * 12.5
dnTF1 = (-MIN(0, d1t1) - MIN(0, d2t1) - MIN(0, d3t1) - MIN(0, d4t1) - MIN(0, d5t1) - MIN(0, dAcT1)) * 12.5
netTF1 = upTF1 - dnTF1
//--------------------------------------------------
// TIMEFRAME 2: 1 HORA
//--------------------------------------------------
TIMEFRAME(1 hour)


IF average[5](close) > average[5](close)[1] THEN
d1t2 = 1
ELSIF average[5](close) < average[5](close)[1] THEN
d1t2 = -1
ELSE
d1t2 = 0
ENDIF


IF average[8](close) > average[8](close)[1] THEN
d2t2 = 1
ELSIF average[8](close) < average[8](close)[1] THEN
d2t2 = -1
ELSE
d2t2 = 0
ENDIF


IF average[13](close) > average[13](close)[1] THEN
d3t2 = 1
ELSIF average[13](close) < average[13](close)[1] THEN
d3t2 = -1
ELSE
d3t2 = 0
ENDIF


IF average[21](close) > average[21](close)[1] THEN
d4t2 = 1
ELSIF average[21](close) < average[21](close)[1] THEN
d4t2 = -1
ELSE
d4t2 = 0
ENDIF


IF average[34](close) > average[34](close)[1] THEN
d5t2 = 1
ELSIF average[34](close) < average[34](close)[1] THEN
d5t2 = -1
ELSE
d5t2 = 0
ENDIF


aoTF2 = average[5](MedianPrice) - average[34](MedianPrice)
acTF2 = aoTF2 - average[5](aoTF2)


IF (acTF2[1] > acTF2[2] AND acTF2[2] > acTF2[3] AND acTF2 < 0 AND acTF2 > acTF2[1]) OR (acTF2 > acTF2[1] AND acTF2[1] > acTF2[2] AND acTF2 > 0) THEN
dAcT2 = 3
ELSIF (acTF2[1] < acTF2[2] AND acTF2[2] < acTF2[3] AND acTF2 > 0 AND acTF2 < acTF2[1]) OR (acTF2 < acTF2[1] AND acTF2[1] < acTF2[2] AND acTF2 < 0) THEN
dAcT2 = -3
ELSE
dAcT2 = 0
ENDIF


upTF2 = (MAX(0, d1t2) + MAX(0, d2t2) + MAX(0, d3t2) + MAX(0, d4t2) + MAX(0, d5t2) + MAX(0, dAcT2)) * 12.5
dnTF2 = (-MIN(0, d1t2) - MIN(0, d2t2) - MIN(0, d3t2) - MIN(0, d4t2) - MIN(0, d5t2) - MIN(0, dAcT2)) * 12.5
netTF2 = upTF2 - dnTF2


//--------------------------------------------------
// TIMEFRAME 3: 4 HORAS
//--------------------------------------------------
TIMEFRAME(4 hours)


IF average[5](close) > average[5](close)[1] THEN
d1t3 = 1
ELSIF average[5](close) < average[5](close)[1] THEN
d1t3 = -1
ELSE
d1t3 = 0
ENDIF


IF average[8](close) > average[8](close)[1] THEN
d2t3 = 1
ELSIF average[8](close) < average[8](close)[1] THEN
d2t3 = -1
ELSE
d2t3 = 0
ENDIF


IF average[13](close) > average[13](close)[1] THEN
d3t3 = 1
ELSIF average[13](close) < average[13](close)[1] THEN
d3t3 = -1
ELSE
d3t3 = 0
ENDIF


IF average[21](close) > average[21](close)[1] THEN
d4t3 = 1
ELSIF average[21](close) < average[21](close)[1] THEN
d4t3 = -1
ELSE
d4t3 = 0
ENDIF


IF average[34](close) > average[34](close)[1] THEN
d5t3 = 1
ELSIF average[34](close) < average[34](close)[1] THEN
d5t3 = -1
ELSE
d5t3 = 0
ENDIF


aoTF3 = average[5](MedianPrice) - average[34](MedianPrice)
acTF3 = aoTF3 - average[5](aoTF3)


IF (acTF3[1] > acTF3[2] AND acTF3[2] > acTF3[3] AND acTF3 < 0 AND acTF3 > acTF3[1]) OR (acTF3 > acTF3[1] AND acTF3[1] > acTF3[2] AND acTF3 > 0) THEN
dAcT3 = 3
ELSIF (acTF3[1] < acTF3[2] AND acTF3[2] < acTF3[3] AND acTF3 > 0 AND acTF3 < acTF3[1]) OR (acTF3 < acTF3[1] AND acTF3[1] < acTF3[2] AND acTF3 < 0) THEN
dAcT3 = -3
ELSE
dAcT3 = 0
ENDIF


upTF3 = (MAX(0, d1t3) + MAX(0, d2t3) + MAX(0, d3t3) + MAX(0, d4t3) + MAX(0, d5t3) + MAX(0, dAcT3)) * 12.5
dnTF3 = (-MIN(0, d1t3) - MIN(0, d2t3) - MIN(0, d3t3) - MIN(0, d4t3) - MIN(0, d5t3) - MIN(0, dAcT3)) * 12.5
netTF3 = upTF3 - dnTF3


TIMEFRAME(default)
//--------------------------------------------------
// SEÑAL DE CONFLUENCIA
//--------------------------------------------------
signal = 0


IF upTF1 > 50 AND upTF2 > 50 AND upTF3 > 50 THEN
signal = 1
ENDIF
IF dnTF1 > 50 AND dnTF2 > 50 AND dnTF3 > 50 THEN
signal = -1
ENDIF
IF upTF1 >= 75 AND upTF2 >= 75 AND upTF3 >= 75 THEN
signal = 2
ENDIF
IF dnTF1 >= 75 AND dnTF2 >= 75 AND dnTF3 >= 75 THEN
signal = -2
ENDIF


//--------------------------------------------------
// COLORES DINÁMICOS PARA LAS LÍNEAS
//--------------------------------------------------
IF netTF1 > 0 THEN
r1 = 0
g1 = 150
b1 = 255
ELSIF netTF1 < 0 THEN
r1 = 255
g1 = 80
b1 = 80
ELSE
r1 = 150
g1 = 150
b1 = 150
ENDIF


IF netTF2 > 0 THEN
r2line = 0
g2line = 100
b2line = 255
ELSIF netTF2 < 0 THEN
r2line = 255
g2line = 50
b2line = 50
ELSE
r2line = 150
g2line = 150
b2line = 150
ENDIF


IF netTF3 > 0 THEN
r3 = 0
g3 = 200
b3 = 100
ELSIF netTF3 < 0 THEN
r3 = 200
g3 = 0
b3 = 0
ELSE
r3 = 150
g3 = 150
b3 = 150
ENDIF


//--------------------------------------------------
// COLORBETWEEN: Zona de confluencia
//--------------------------------------------------
refTop = 100
refBot = -100


IF netTF1 > 0 AND netTF2 > 0 AND netTF3 > 0 THEN
aBull = 30
ELSE
aBull = 0
ENDIF


IF netTF1 < 0 AND netTF2 < 0 AND netTF3 < 0 THEN
aBear = 30
ELSE
aBear = 0
ENDIF


COLORBETWEEN(refTop, refBot, 0, 180, 0, aBull)
COLORBETWEEN(refTop, refBot, 200, 0, 0, aBear)


//--------------------------------------------------
// TABLA ANCLADA TOPRIGHT
//--------------------------------------------------
zeroLine = 0
lvl50 = 50
lvlN50 = -50


// Colores para la tabla según dirección
IF netTF1 > 0 THEN
rt1 = 0
gt1 = 200
bt1 = 100
ELSIF netTF1 < 0 THEN
rt1 = 255
gt1 = 80
bt1 = 80
ELSE
rt1 = 180
gt1 = 180
bt1 = 180
ENDIF


IF netTF2 > 0 THEN
rt2 = 0
gt2 = 200
bt2 = 100
ELSIF netTF2 < 0 THEN
rt2 = 255
gt2 = 80
bt2 = 80
ELSE
rt2 = 180
gt2 = 180
bt2 = 180
ENDIF


IF netTF3 > 0 THEN
rt3 = 0
gt3 = 200
bt3 = 100
ELSIF netTF3 < 0 THEN
rt3 = 255
gt3 = 80
bt3 = 80
ELSE
rt3 = 180
gt3 = 180
bt3 = 180
ENDIF


// Color señal
IF signal >= 1 THEN
rSig = 0
gSig = 255
bSig = 0
ELSIF signal <= -1 THEN
rSig = 255
gSig = 0
bSig = 0
ELSE
rSig = 180
gSig = 180
bSig = 180
ENDIF


IF islastbarupdate THEN
// Fila 0: Título
DRAWTEXT("TREND CONFLUENCE", -200, -20) COLOURED(200, 200, 200) anchor(topright, xshift, yshift)
// Fila 1: TF1
DRAWTEXT("15m: UP #upTF1#%  DN #dnTF1#%", -200, -40) COLOURED(rt1, gt1, bt1) anchor(topright, xshift, yshift)
// Fila 2: TF2
DRAWTEXT("1H:  UP #upTF2#%  DN #dnTF2#%", -200, -60) COLOURED(rt2, gt2, bt2) anchor(topright, xshift, yshift)
// Fila 3: TF3
DRAWTEXT("4H:  UP #upTF3#%  DN #dnTF3#%", -200, -80) COLOURED(rt3, gt3, bt3) anchor(topright, xshift, yshift)
// Fila 4: Señal
IF signal = 2 THEN
DRAWTEXT(">>> GOOD BUY <<<", -200, -105) COLOURED(rSig, gSig, bSig) anchor(topright, xshift, yshift)
ELSIF signal = 1 THEN
DRAWTEXT(">>> BUY <<<", -200, -105) COLOURED(rSig, gSig, bSig) anchor(topright, xshift, yshift)
ELSIF signal = -2 THEN
DRAWTEXT(">>> GOOD SELL <<<", -200, -105) COLOURED(rSig, gSig, bSig) anchor(topright, xshift, yshift)
ELSIF signal = -1 THEN
DRAWTEXT(">>> SELL <<<", -200, -105) COLOURED(rSig, gSig, bSig) anchor(topright, xshift, yshift)
ELSE
DRAWTEXT("--- WAIT ---", -200, -105) COLOURED(rSig, gSig, bSig) anchor(topright, xshift, yshift)
ENDIF
ENDIF


//--------------------------------------------------
RETURN netTF1 COLOURED(r1, g1, b1) AS "15min", netTF2 COLOURED(r2line, g2line, b2line) AS "1H", netTF3 COLOURED(r3, g3, b3) AS "4H", zeroLine COLOURED(100, 100, 100) style(dottedline, 1) AS "Zero", lvl50 COLOURED(100, 100, 100) style(dottedline, 1) AS "+50", lvlN50 COLOURED(100, 100, 100) style(dottedline, 1) AS "-50"
