

Trend Line Regression Indicator
Drawing trendlines manually is one of the oldest techniques in technical analysis, but it comes with a major flaw: it is highly subjective. Two traders looking at the exact same chart will often draw two completely different trendlines.
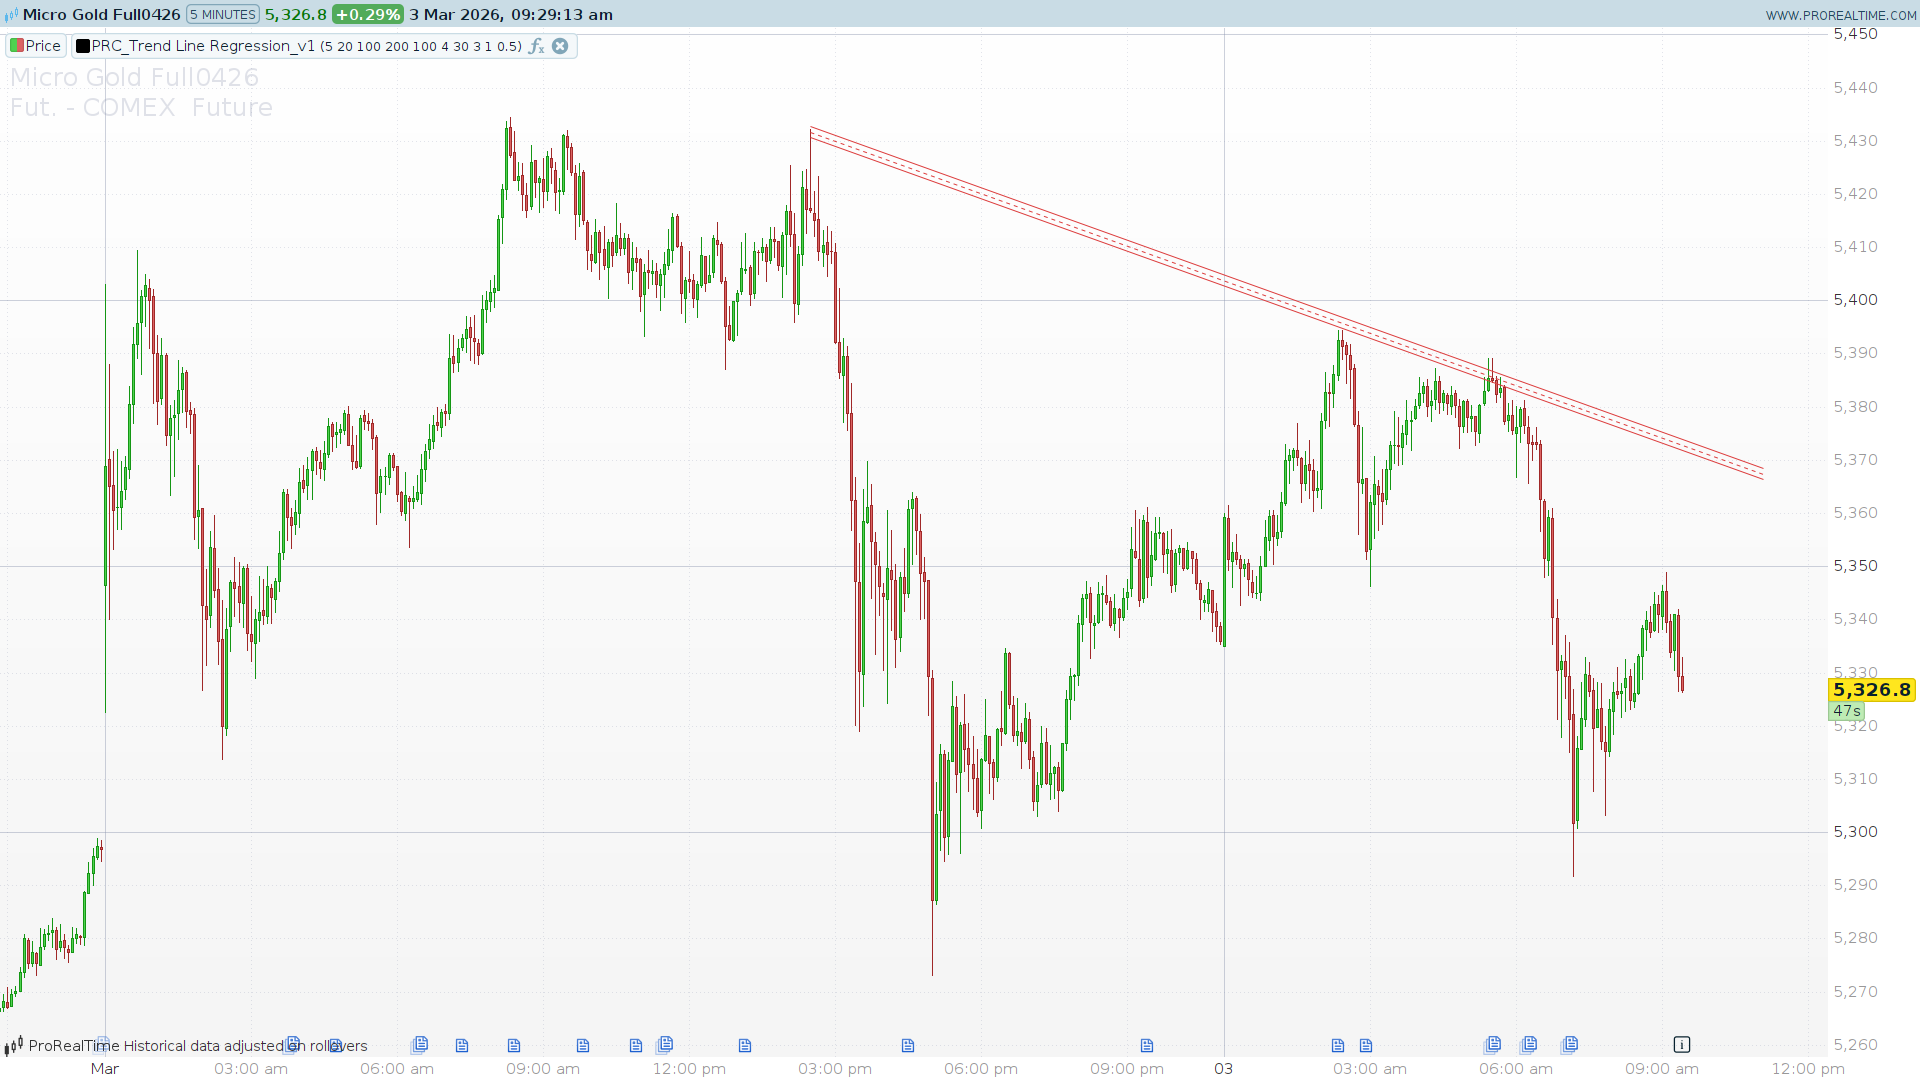
To solve this, we introduce the Trend Line Regression. This custom tool uses advanced mathematics to automatically identify significant swing points and draw objective, mathematically sound trend channels. Whether you are a day trader looking for intraday breakouts or a swing trader riding long-term trends, this indicator brings pure objectivity to your chart analysis.
How the Trend Line Regression Indicator Works
Most standard regression tools simply draw a “line of best fit” straight through the middle of the price action. This indicator goes several steps further by using an iterative fitting process.
Here is the logic broken down:
- Pivot Detection: First, the algorithm scans the chart to find significant Pivot Highs (peaks) and Pivot Lows (valleys) based on your chosen lookback periods.
- Iterative Linear Regression: Instead of just drawing a line through the middle, the algorithm calculates a linear regression specifically on these pivot points. It then iteratively filters out the “weaker” points, forcing the upper line to “hug” the highest peaks and the lower line to rest precisely on the deepest valleys.
- Standard Deviation Channels: Finally, it projects an outer boundary based on standard deviation, creating a dynamic channel that encapsulates the current trend’s volatility.
Because the calculations are heavy and look back across hundreds of bars, the indicator uses defparam drawonlastbaronly = true. This ensures your ProRealTime platform runs smoothly by only drawing the definitive trendlines on the most current bar.
How to Use It in Your Trading
This indicator is highly versatile and can be adapted to various trading styles:
- Trend Following: Trade in the direction of the channel. Buy near the lower boundary of an ascending channel and sell near the upper boundary of a descending channel.
- Breakout Trading: Wait for a decisive candlestick close outside the projected standard deviation lines. A strong close above the upper resistance line often signals a powerful bullish breakout.
- Dynamic Stop Losses: Use the opposing trendline or the standard deviation bands as logical, mathematically backed areas to place trailing stops.
Configuration & Parameters Explained
One of the greatest strengths of this code is its high degree of customization. Here is what each parameter does so you can tweak it to your preferred timeframe and asset:
prdR&prdL(Pivot Lookback Right/Left): Defines the strength of the pivot points. A value of 5 means a high must be higher than the 5 bars to its left and the 5 bars to its right. Increase this for major macro trends, decrease it for sensitive short-term trends.forward: The number of bars the trendline is projected into the future (the blank space on the right side of your chart).minRegLen&maxRegLen: The minimum and maximum historical lookback length the algorithm will use to find the best-fitting regression line.regSteps: The step interval between the minimum and maximum lengths.maxIter: The number of times the algorithm filters the points to “hug” the extremes. A higher number makes the line tighter to the absolute extremes.maxPts&minPts: The maximum and minimum number of pivot points required to validate a trendline.minLevel: A quality filter for the regression. Only trends that meet this statistical threshold of significance will be drawn.stdMult: Multiplier for the standard deviation outer bands. Increasing this widens the channel, capturing more price action and filtering out false breakouts.
The ProBuilder Code
// -------------------------------------
// PRC_Trend Line Regression
// version = 0
// 03.03.2026
// Iván González @ www.prorealcode.com
// Sharing ProRealTime knowledge
// -------------------------------------
defparam drawonlastbaronly = true
// -------------------------------------
// === PARAMETERS ===
// -------------------------------------
prdR = 5           // Pivot Lookback Right
prdL = prdR           // Pivot Lookback Left
forward = 20       // Max Lookback Forward / Extension
minRegLen = 100    // Min Regression Length
maxRegLen = 200    // Max Regression Length
regSteps = 100     // Regression Length Steps
maxIter = 4        // Max Iterations of Regression
maxPts = 30        // Max Point Numbers of Trend Line
minPts = 3         // Min Point Numbers of Trend Line
minLevel = 1       // Min Regression Level (original=4)
stdMult = 0.5      // Multiply Regression Std
// -------------------------------------
// === STEP 1: DETECT PIVOTS ===
// -------------------------------------
once phCnt = 0
once plCnt = 0

if barindex >= prdL + prdR then
   isPH = 1
   for k = 0 to prdL + prdR do
      if k <> prdL then
         if high[prdR] < high[prdR - prdL + k] then
            isPH = 0
         endif
      endif
   next
   if isPH then
      $phP[phCnt] = high[prdR]
      $phB[phCnt] = barindex - prdR
      phCnt = phCnt + 1
   endif

   isPL = 1
   for k = 0 to prdL + prdR do
      if k <> prdL then
         if low[prdR] > low[prdR - prdL + k] then
            isPL = 0
         endif
      endif
   next
   if isPL then
      $plP[plCnt] = low[prdR]
      $plB[plCnt] = barindex - prdR
      plCnt = plCnt + 1
   endif
endif
// --------------------------------------------------
// === STEP 2: CALCULATE + DRAW (last bar only) ===
// --------------------------------------------------
if islastbarupdate then

   numSteps = round((maxRegLen - minRegLen) / max(1, regSteps))

   for stepIdx = 0 to numSteps do
      tryLen = minRegLen + stepIdx * regSteps

      // ============================================
      // TOP TREND LINE (pivot highs)
      // ============================================
      nTop = 0
      for i = 0 to phCnt - 1 do
         detOff = barindex - ($phB[i] + prdR)
         if detOff >= forward and detOff <= forward + tryLen - 1 and nTop < maxPts then
            $tW[nTop] = detOff + prdL
            $pW[nTop] = $phP[i]
            nTop = nTop + 1
         endif
      next

      if nTop > minPts then
         sT = 0
         sP = 0
         sT2 = 0
         sPT = 0
         for i = 0 to nTop - 1 do
            sT = sT + $tW[i]
            sP = sP + $pW[i]
            sT2 = sT2 + $tW[i] * $tW[i]
            sPT = sPT + $pW[i] * $tW[i]
         next

         dd = nTop * sT2 - sT * sT
         if dd <> 0 then
            tSlp = (nTop * sPT - sP * sT) / dd
            tInt = (sP - tSlp * sT) / nTop

            pAv = sP / nTop
            s1 = 0
            s2v = 0
            sDf = 0
            for i = 0 to nTop - 1 do
               pp = tSlp * $tW[i] + tInt
               s1 = s1 + SQUARE(pp - pAv)
               s2v = s2v + SQUARE($pW[i] - pAv)
               sDf = sDf + SQUARE($pW[i] - pp)
            next

            tStd = SQRT(sDf / max(1, nTop))
            itr = 0
            if s2v > 0 then
               rr = s1 / s2v
               if rr > 0 and rr < 1 then
                  itr = -LOG(1 - rr) / LOG(10)
               elsif rr >= 1 then
                  itr = 999
               endif
            endif

            // Iterative TOP fitting
            for i = 0 to nTop - 1 do
               $tI[i] = $tW[i]
               $pI[i] = $pW[i]
            next
            nI = nTop
            cSlp = tSlp
            cInt = tInt
            cR = itr

            for iter = 0 to maxIter - 1 do
               if nI <= minPts then
                  break
               endif

               nF = 0
               for j = 0 to nI - 1 do
                  pp = cSlp * $tI[j] + cInt
                  if $pI[j] > pp then
                     $tF[nF] = $tI[j]
                     $pF[nF] = $pI[j]
                     nF = nF + 1
                  endif
               next

               if nF <= minPts then
                  break
               endif

               sT = 0
               sP = 0
               sT2 = 0
               sPT = 0
               for i = 0 to nF - 1 do
                  sT = sT + $tF[i]
                  sP = sP + $pF[i]
                  sT2 = sT2 + $tF[i] * $tF[i]
                  sPT = sPT + $pF[i] * $tF[i]
               next

               dd = nF * sT2 - sT * sT
               if dd = 0 then
                  break
               endif

               nSlp = (nF * sPT - sP * sT) / dd
               nInt = (sP - nSlp * sT) / nF

               pAv = sP / nF
               s1 = 0
               s2v = 0
               sDf = 0
               for i = 0 to nF - 1 do
                  pp = nSlp * $tF[i] + nInt
                  s1 = s1 + SQUARE(pp - pAv)
                  s2v = s2v + SQUARE($pF[i] - pAv)
                  sDf = sDf + SQUARE($pF[i] - pp)
               next

               nR = 0
               if s2v > 0 then
                  rr = s1 / s2v
                  if rr > 0 and rr < 1 then
                     nR = -LOG(1 - rr) / LOG(10)
                  elsif rr >= 1 then
                     nR = 999
                  endif
               endif

               if nR > cR then
                  tSlp = nSlp
                  tInt = nInt
                  itr = nR
                  tStd = SQRT(sDf / max(1, nF))
                  cSlp = nSlp
                  cInt = nInt
                  cR = nR
                  nI = nF
                  for k = 0 to nF - 1 do
                     $tI[k] = $tF[k]
                     $pI[k] = $pF[k]
                  next
               else
                  break
               endif
            next

            // DRAW TOP if valid
            if nI > minPts and itr > minLevel then
               txLeft = $tI[0]
               oSt = tStd * stdMult
               yL = tSlp * txLeft + tInt
               yExt = tSlp * (-forward) + tInt

               drawsegment(barindex - txLeft, yL, barindex + forward, yExt) coloured(220, 60, 60) style(dottedline, 1)
               drawsegment(barindex - txLeft, yL + oSt, barindex + forward, yExt + oSt) coloured(220, 60, 60) style(line, 1)
               drawsegment(barindex - txLeft, yL - oSt, barindex + forward, yExt - oSt) coloured(220, 60, 60) style(line, 1)
            endif
         endif
      endif

      // ============================================
      // BOTTOM TREND LINE (pivot lows)
      // ============================================
      nBot = 0
      for i = 0 to plCnt - 1 do
         detOff = barindex - ($plB[i] + prdR)
         if detOff >= forward and detOff <= forward + tryLen - 1 and nBot < maxPts then
            $tW[nBot] = detOff + prdL
            $pW[nBot] = $plP[i]
            nBot = nBot + 1
         endif
      next

      if nBot > minPts then
         sT = 0
         sP = 0
         sT2 = 0
         sPT = 0
         for i = 0 to nBot - 1 do
            sT = sT + $tW[i]
            sP = sP + $pW[i]
            sT2 = sT2 + $tW[i] * $tW[i]
            sPT = sPT + $pW[i] * $tW[i]
         next

         dd = nBot * sT2 - sT * sT
         if dd <> 0 then
            bSlp = (nBot * sPT - sP * sT) / dd
            bInt = (sP - bSlp * sT) / nBot

            pAv = sP / nBot
            s1 = 0
            s2v = 0
            sDf = 0
            for i = 0 to nBot - 1 do
               pp = bSlp * $tW[i] + bInt
               s1 = s1 + SQUARE(pp - pAv)
               s2v = s2v + SQUARE($pW[i] - pAv)
               sDf = sDf + SQUARE($pW[i] - pp)
            next

            bStd = SQRT(sDf / max(1, nBot))
            bR = 0
            if s2v > 0 then
               rr = s1 / s2v
               if rr > 0 and rr < 1 then
                  bR = -LOG(1 - rr) / LOG(10)
               elsif rr >= 1 then
                  bR = 999
               endif
            endif

            // Iterative BOTTOM fitting
            for i = 0 to nBot - 1 do
               $tI[i] = $tW[i]
               $pI[i] = $pW[i]
            next
            nI = nBot
            cSlp = bSlp
            cInt = bInt
            cR = bR

            for iter = 0 to maxIter - 1 do
               if nI <= minPts then
                  break
               endif

               nF = 0
               for j = 0 to nI - 1 do
                  pp = cSlp * $tI[j] + cInt
                  if $pI[j] < pp then
                     $tF[nF] = $tI[j]
                     $pF[nF] = $pI[j]
                     nF = nF + 1
                  endif
               next

               if nF <= minPts then
                  break
               endif

               sT = 0
               sP = 0
               sT2 = 0
               sPT = 0
               for i = 0 to nF - 1 do
                  sT = sT + $tF[i]
                  sP = sP + $pF[i]
                  sT2 = sT2 + $tF[i] * $tF[i]
                  sPT = sPT + $pF[i] * $tF[i]
               next

               dd = nF * sT2 - sT * sT
               if dd = 0 then
                  break
               endif

               nSlp = (nF * sPT - sP * sT) / dd
               nInt = (sP - nSlp * sT) / nF

               pAv = sP / nF
               s1 = 0
               s2v = 0
               sDf = 0
               for i = 0 to nF - 1 do
                  pp = nSlp * $tF[i] + nInt
                  s1 = s1 + SQUARE(pp - pAv)
                  s2v = s2v + SQUARE($pF[i] - pAv)
                  sDf = sDf + SQUARE($pF[i] - pp)
               next

               nR = 0
               if s2v > 0 then
                  rr = s1 / s2v
                  if rr > 0 and rr < 1 then
                     nR = -LOG(1 - rr) / LOG(10)
                  elsif rr >= 1 then
                     nR = 999
                  endif
               endif

               if nR > cR then
                  bSlp = nSlp
                  bInt = nInt
                  bR = nR
                  bStd = SQRT(sDf / max(1, nF))
                  cSlp = nSlp
                  cInt = nInt
                  cR = nR
                  nI = nF
                  for k = 0 to nF - 1 do
                     $tI[k] = $tF[k]
                     $pI[k] = $pF[k]
                  next
               else
                  break
               endif
            next

            // DRAW BOTTOM if valid
            if nI > minPts and bR > minLevel then
               bxLeft = $tI[0]
               oSt = bStd * stdMult
               yL = bSlp * bxLeft + bInt
               yExt = bSlp * (-forward) + bInt

               drawsegment(barindex - bxLeft, yL, barindex + forward, yExt) coloured(46, 180, 80) style(dottedline, 1)
               drawsegment(barindex - bxLeft, yL + oSt, barindex + forward, yExt + oSt) coloured(46, 180, 80) style(line, 1)
               drawsegment(barindex - bxLeft, yL - oSt, barindex + forward, yExt - oSt) coloured(46, 180, 80) style(line, 1)
            endif
         endif
      endif

   next // stepIdx

endif

return
