

Trend Line Fibonacci
November 30, 2020, 11:34 AM
Indicators
6 Comments
This indicator uses retracement periods of (23,38,50,61)
The indicator calculates as follows(Highest[X](high) + Lowest[X](low) + Close) / 3
Once the levels are detected, the code averages the retracements, this way we get a probable pivot point level.
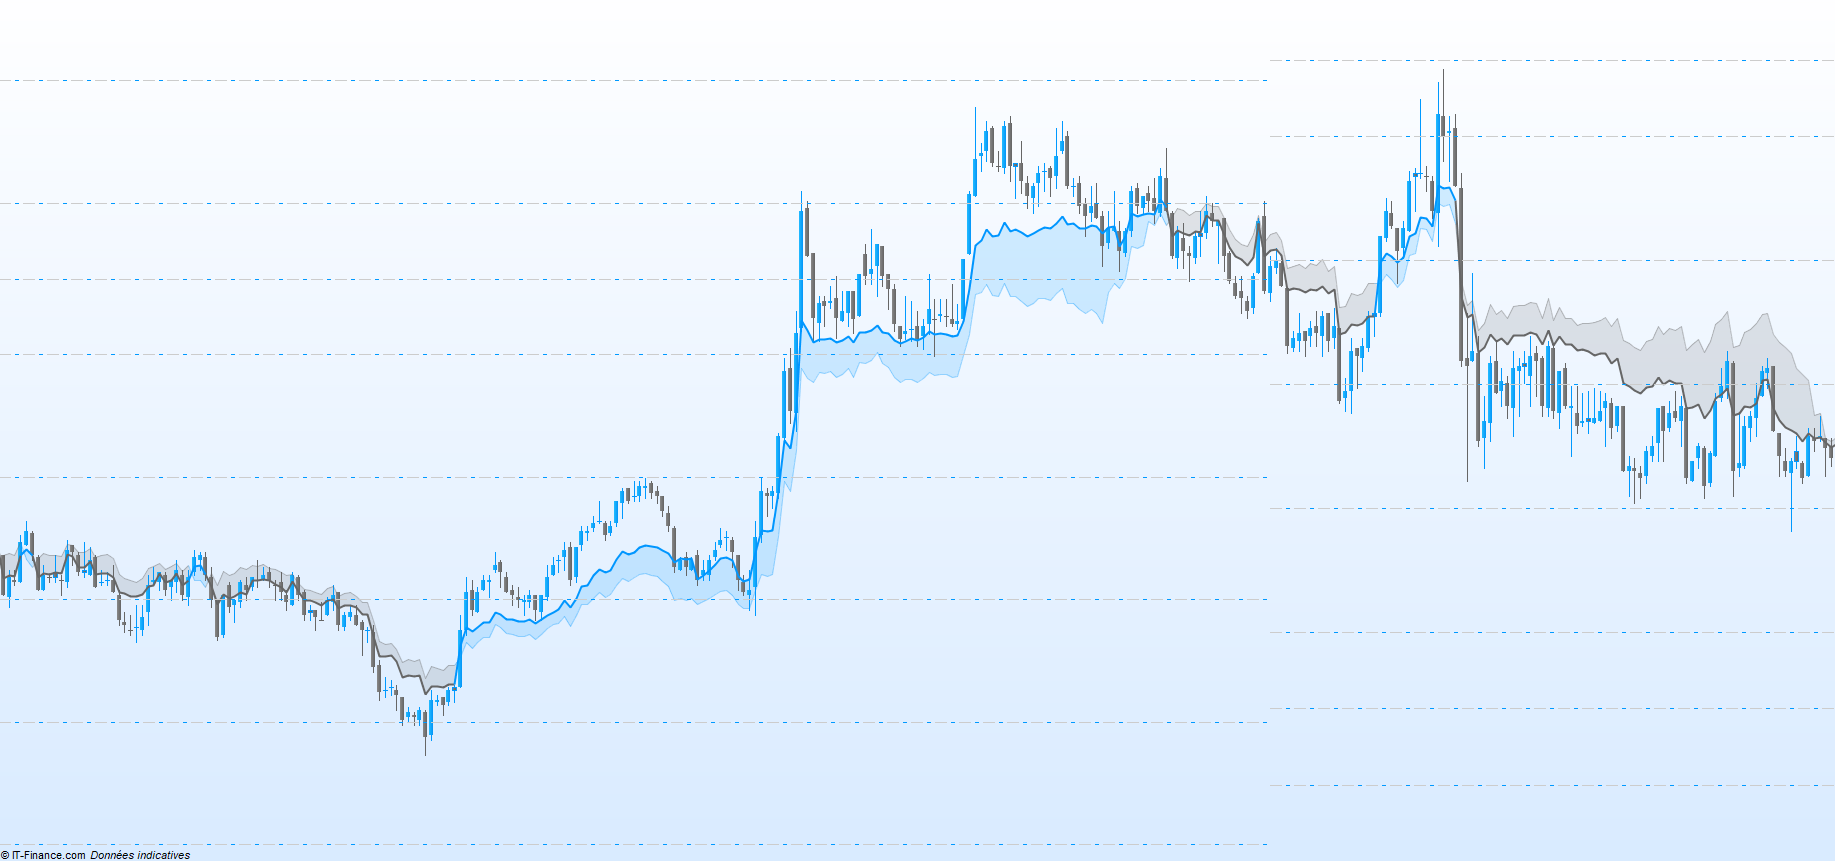
This level is represented by the thickest line of the indicator.
The thinnest line corresponds to the lowest or highest pivot point, which is then useful for determining the directional bias, but also as a pivot level.
The use of this indicator is particularly effective for confirming rebound levels with fibonacci pivot points.
In this way, the approach of the price on a pivot point in confirmation with the “Trend Line Fibonacci” indicator is interesting.
IV
//
//=/===============/=//=/===============/=//=/ Indicateur Fibonacci
//


//
//=/===============/=//=/===============/=//=/ Detection des plus Haut et Bas
//


//=/ Ratio de 23
x23xH = highest[23](high)
x23xL = lowest[23](low)


//=/ Ratio de 38
x38xH = highest[38](high)
x38xL = lowest[38](low)


//=/ Ratio de 50
x50xH = highest[50](high)
x50xL = lowest[50](low)


//=/ Ratio de 61
x61xH = highest[61](high)
x61xL = lowest[61](low)


//
//=/===============/=//=/===============/=//=/ Zone de Pivot
//


//=/ Ratio de 23
x23x = (x23xH+x23xL+close)/3


//=/ Ratio de 38
x38x = (x38xH+x38xL+close)/3


//=/ Ratio de 50
x50x = (x50xH+x50xL+close)/3


//=/ Ratio de 61
x61x = (x61xH+x61xL+close)/3


//=/ Pivot Premier et Second
xPxPremier = (x23x+x38x+x50x+x61x+close)/5
//=//
xPxSecond  = xPxPremier
if close > xPxSecond and xPxSecond < xPxSecond[1] then
xPxSecond = xPxSecond[1]
//=//
elsif close < xPxSecond and xPxSecond > xPxSecond[1] then
xPxSecond = xPxSecond[1]
endif


//=/ Pivot Optimal
xPxOptimal = (xPxSecond+xPxPremier) /2


//
//=/===============/=//=/===============/=//=/ Zone Extreme
//


//=/ Extreme Haut
if x23x => x38x and x23x => x50x and x23x => x61x then
xExHaut = x23x
//=//
elsif x38x => x23x and x38x => x50x and x38x => x61x then
xExHaut = x38x
//=//
elsif x50x => x23x and x50x => x38x and x50x => x61x then
xExHaut = x50x
//=//
elsif x61x => x23x and x61x => x38x and x61x => x50x then
xExHaut = x61x
endif


//=/ Extreme Bas
if x23x =< x38x and x23x =< x50x and x23x =< x61x then
xExBas = x23x
//=//
elsif x38x =< x23x and x38x =< x50x and x38x =< x61x then
xExBas = x38x
//=//
elsif x50x =< x23x and x50x =< x38x and x50x =< x61x then
xExBas = x50x
//=//
elsif x61x =< x23x and x61x =< x38x and x61x =< x50x then
xExBas = x61x
endif


//=/ Point de Tendance
if close > xExHaut and close > xExBas then
xPxT = 1
//=//
elsif close < xExHaut and close < xExBas then
xPxT = -1
endif
//=//
if xPxT = 1 then
xPxTendance = xExBas
//=//
elsif xPxT = -1 then
xPxTendance = xExHaut
endif


//
//=/===============/=//=/===============/=//=/ Coloration des ligne
//

//=/ Ratio de 23
if xPxT = 1 then
R = 0
G = 150
B = 255
T = 100
//=//
elsif xPxT = -1 then
R = 102
G = 102
B = 102
T = 100
endif


//
//=/===============/=//=/===============/=//=/ Fin
//

return xPxTendance coloured(R,G,B,T) style (line,1) as "Tendance", xPxOptimal coloured(R,G,B,255) style (line,2) as "Optimal"
Download
Filename:
Trend-Line-Fibonacci.itf
Downloads:
281
Master
------------------------------------Participating Encoder-----------------------------------
Author’s Profile
Loading...