

Trend Function
Here is an indicator that can help in reading the market
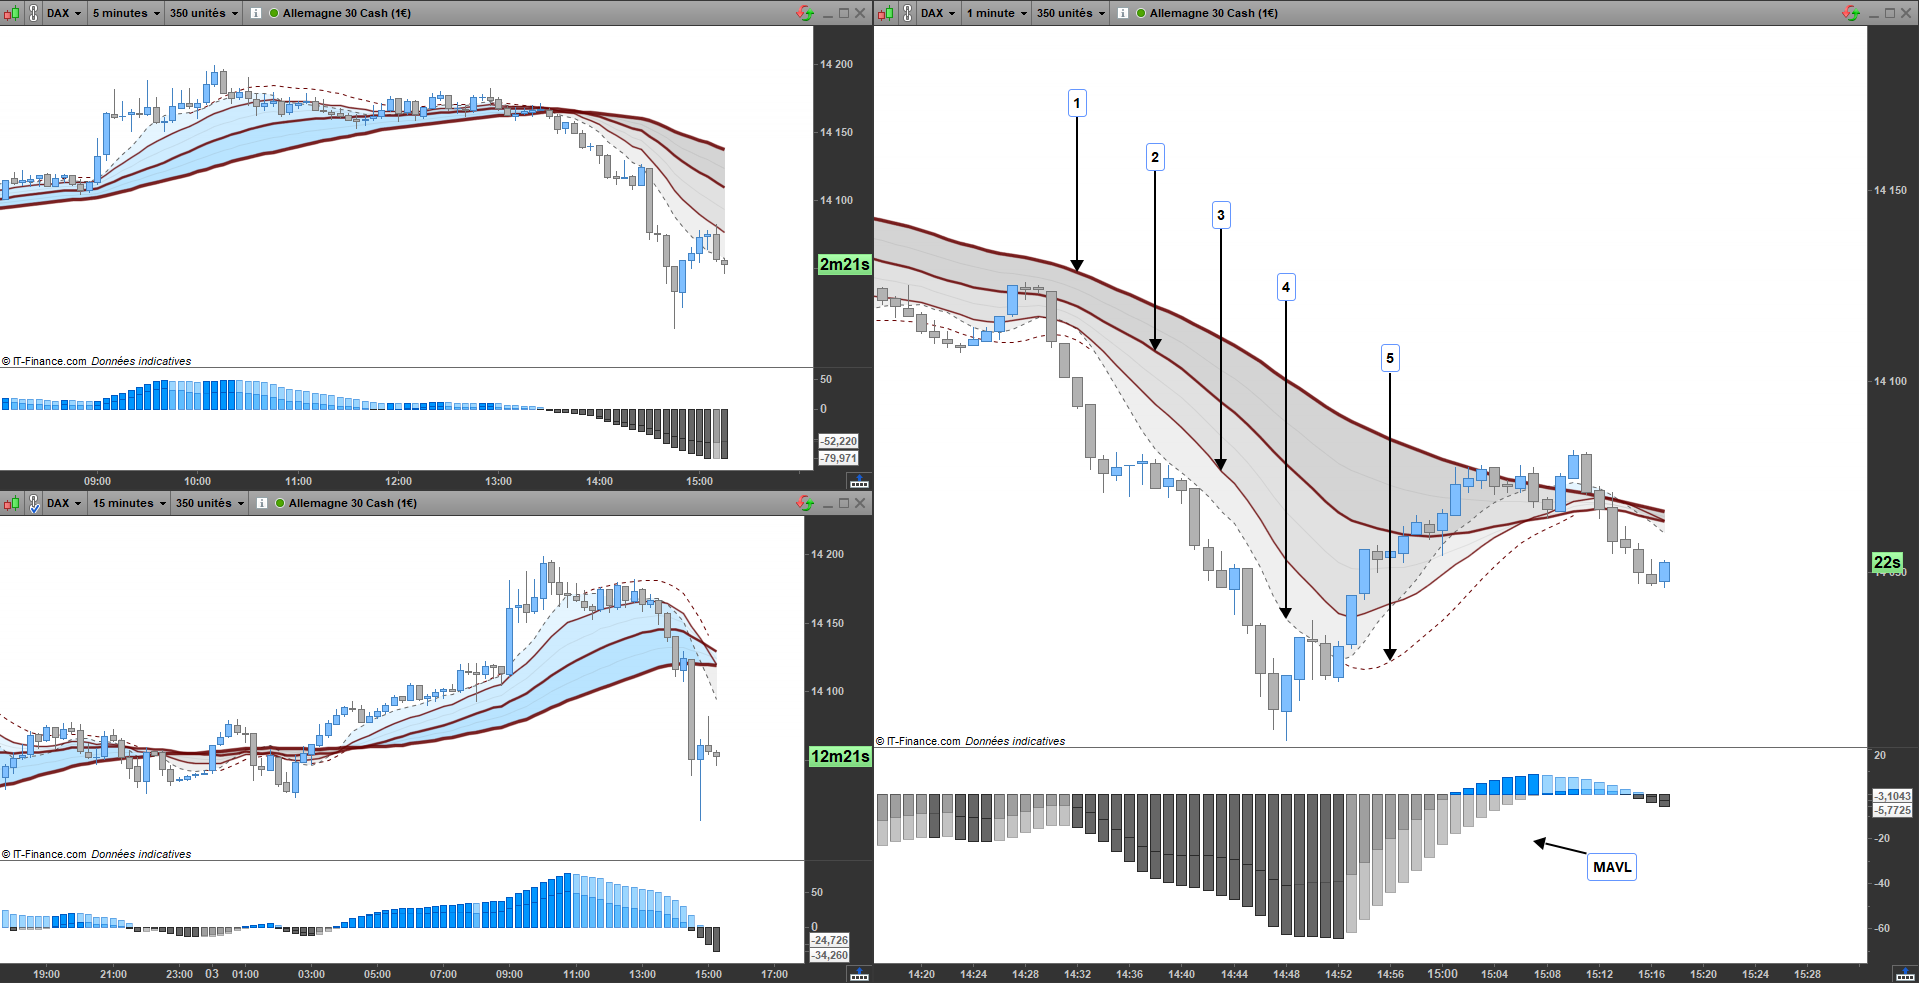
For the explanation, I will start with the main indicator “Trend Function”.
1: Long Line
2: Medium Line
3 : Fast Line
These lines are read together, they allow to give the volatility through their deviations, they are the result of several combined moving average in fibonacci period namely “8 – 13 – 21 – 34 – 55 – 64”.
Line 3 can give another information, if the price is too close, then the trend phase is weak, it is when the prices start to move away from it that we speak of a strong trend.
The line 4, it can confirm the trend according to its positioning, if it is above all the other lines, then the upward trend and confirm, conversely for a downward trend
It can also be used as an entry point when the price crosses the line.
Line 5 is an average that corresponds to several moving means of Hull combined, when this line appears, prices are corrected and the trend marks a weakness, exceeding this line is advisable to take a position in order to regain the strength of the initial trend.
The MAVL indicator, this one calculates the deviation between the averages calculated on the indicator above, a dark blue color indicates an acceleration, a light blue color indicates a deceleration, inversely for bear phases
I recommend the use of Multi-timeframe for more relevance.
It is an indicator delayed by its calculation from moving average, so it serves as a decision aid and not a use of absolute certidute.
//
//=/===============/=//=/===============/=//=/ Average Trend
//

//=/ Average
A1 = average[8](close)
A2 = average[13](close)
A3 = average[21](close)
A4 = average[34](close)
A5 = average[55](close)
A6 = average[64](close)

//=/ Trend Line
L1 = (A1+A2+A3)/3
L2 = (A2+A3+A4+A5)/4
L3 = (A4+A5+A6)/3
//=//
L4 = (L1+L2)/2
L5 = (L2+L3)/2

//=/ Hull
A1X = 2*weightedaverage[round(21/2)](close)-weightedaverage[21](close)
H1 = weightedaverage[round(sqrt(21))](A1X)
//=//
A2X = 2*weightedaverage[round(34/2)](close)-weightedaverage[34](close)
H2 = weightedaverage[round(sqrt(34))](A2X)
//=//
A3X = 2*weightedaverage[round(55/2)](close)-weightedaverage[55](close)
H3 = weightedaverage[round(sqrt(55))](A3X)
//=//
A4X = 2*weightedaverage[round(64/2)](close)-weightedaverage[64](close)
H4 = weightedaverage[round(sqrt(64))](A4X)
//=//
TH = (H1+H2+H3+H4)/4
//=//
if (TH > L4 and TH > L5 and TH > A1 and TH > L1 and TH > L2 and TH > L3) or (TH < L4 and TH < L5 and TH < A1 and TH < L1 and TH < L2 and TH < L3) then
CR = 255
else
CR = 0
endif

//
//=/===============/=//=/===============/=//=/ Fin
//

return TH coloured(103,0,0,CR) style (dottedline,1) as "TH", L4 coloured(102,102,102,30) style (line,1) as "L4", L5 coloured(102,102,102,30) style (line,1) as "L5", A1 coloured(102,102,102,255) style (dottedline,1) as "A1", L1 coloured(103,0,0,100) style(line,2) as "L1", L2 coloured(103,0,0,100) style(line,3) as "L2", L3 coloured(103,0,0,100) style(line,4) as "L3", L1 coloured(103,0,0,200) style(line,1) as "L1", L2 coloured(103,0,0,200) style(line,2) as "L2", L3 coloured(103,0,0,200) style(line,3) as "L3"
//
//=/===============/=//=/===============/=//=/ MAVL
//
//=/ Average
A1 = average[8](close)
A2 = average[13](close)
A3 = average[21](close)
A4 = average[34](close)
A5 = average[55](close)
A6 = average[64](close)
//=/ Trend Line
L1 = (A1+A2+A3)/3
L2 = (A2+A3+A4+A5)/4
L3 = (A4+A5+A6)/3
//=//
L4 = (L1+L2)/2
L5 = (L2+L3)/2
//
//=/===============/=//=/===============/=//=/ Coloration
//
//=/ MAVL
TH1 = (L5-L3) + (L2-L5) + (L4-L2) + (L1-L4) + (A1-L1)
TH2 = (L4-L2) + (L1-L4) + (A1-L1)
if TH1 => 0 and TH1 > TH1[1] then
R = 0
G = 150
B = 255
T = 255
elsif TH1 => 0 and TH1 = TH1[1] then
R = 255
G = 51
B = 0
T = 100
elsif TH1 => 0 and TH1 < TH1[1] then
R = 0
G = 150
B = 255
T = 100
elsif TH1 < 0 and TH1 < TH1[1] then
R = 102
G = 102
B = 102
T = 255
elsif TH1 < 0 and TH1 = TH1[1] then
R = 255
G = 51
B = 0
T = 100
elsif TH1 < 0 and TH1 > TH1[1] then
R = 102
G = 102
B = 102
T = 100
endif
if TH2 => 0 and TH2 > TH2[1] then
RX = 0
GX = 150
BX = 255
TX = 255
elsif TH2 => 0 and TH2 = TH2[1] then
RX = 255
GX = 51
BX = 0
TX = 100
elsif TH2 => 0 and TH2 < TH2[1] then
RX = 0
GX = 150
BX = 255
TX = 100
elsif TH2 < 0 and TH2 < TH2[1] then
RX = 102
GX = 102
BX = 102
TX = 255
elsif TH2 < 0 and TH2 = TH2[1] then
RX = 255
GX = 51
BX = 0
TX = 100
elsif TH2 < 0 and TH2 > TH2[1] then
RX = 102
GX = 102
BX = 102
TX = 100
endif
//
//=/===============/=//=/===============/=//=/ Fin
//
return TH1 coloured(R,G,B,T) style(histogram,1) as "MAVL", TH2 coloured(RX,GX,BX,TX) style(histogram,1) as "MAVL // L"