

Trend Follower
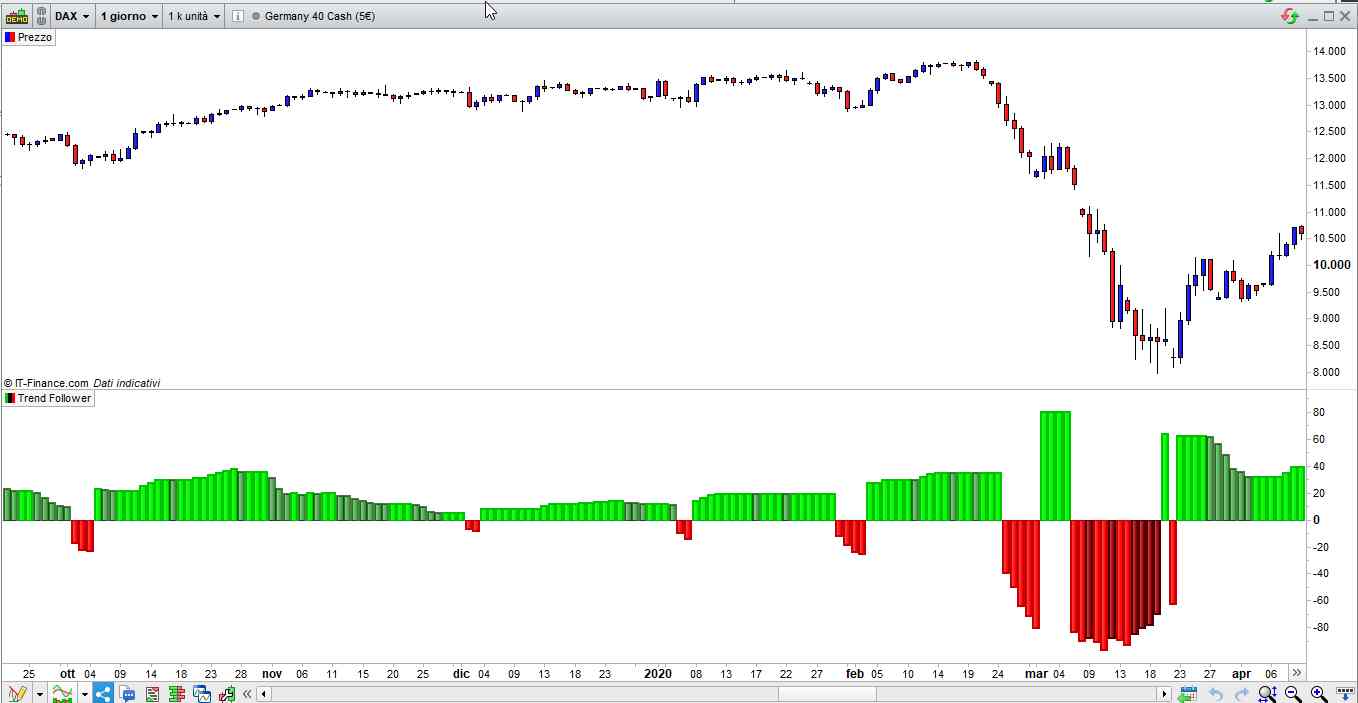
It analyses moving averages in a channel and their momentum according to the channel width.
On each bar it creates a channel by highest/lowest point of a MA. highest point is upper point and lowest point is lower point of the MA channel.
It gets highest and lowest point of last 300 bars, (say Price Channel )
If the width of MA channel is greater than certain rate of price channel then it decides there is trend.
After it decided there is trend, it calculates the rate between channel and MA. Bigger result means stronger trend.
According to rate of MA channel and the price channel , bar color becomes lighter/darker. so when you look at the bar color you can see the trend strength.
The darker the colour, the weeker the trend is.
Upon a request from user denmar (https://www.prorealcode.com/topic/help-converting-trend-follower-indicator-from-trading-view/) I converted this indicator written by LonesomeTheBlue.
// Trend Follower
//
// https://it.tradingview.com/script/o0ZOSVHj-Trend-Follower/
//
//MAtype    = 1        //1=Ema
//TrendP    = 20       //20 periods to check trend
//MAperiods = 20       //20 periods for MA
//TrendRate = 1        //1%  trend channel rate
//UseLR     = 1        //1=use Linear Regression,  0=do not use LR
//LRperiods = 5        //5  periods for Linear Regression
//RangeP    = 300      //300 period for the range
MAtype    = max(0,min(8,MAtype))
TrendP    = max(1,min(999,TrendP))
MAperiods = max(1,min(999,MAperiods))
TrendRate = max(0.00001,min(99,TrendRate))
RangeP    = max(1,min(999,RangeP))
//
RateMult  = TrendRate / 100
PriceRange= highest[RangeP](high) - lowest[RangeP](low)
MyChannel = PriceRange * RateMult
MyMA      = average[MAperiods,MAtype](close)
IF UseLR THEN
   MyMA   = LinearRegression[LRperiods](close)
ENDIF
hh        = highest[TrendP](MyMA)
ll        = lowest[TrendP](MyMA)
diff      = abs(hh - ll)
x         = 0
IF diff > MyChannel THEN
   IF MyMA > (ll + MyChannel) THEN
      x   = 1
   ELSE
      IF MyMA < (hh - MyChannel) THEN
         x = -1
      ENDIF
   ENDIF
ENDIF
Trend = x * diff / MyChannel
IF Trend > 0 THEN
   r = 0
   g = 255
   b = 0
   t = 255
   IF Trend < Trend[1] THEN
      g = 128
      t = 180
   ENDIF
ELSE
   r = 255
   g = 0
   b = 0
   t = 255
   IF Trend > Trend[1] THEN
      r = 139
      g = 0
      b = 0
      t = 255
   ENDIF
ENDIF
RETURN Trend coloured(r,g,b,t) style(histogram,2) AS "Trend",0 coloured(0,0,255,32) style(dottedline,2) AS "Zero"