Trend Envelopes
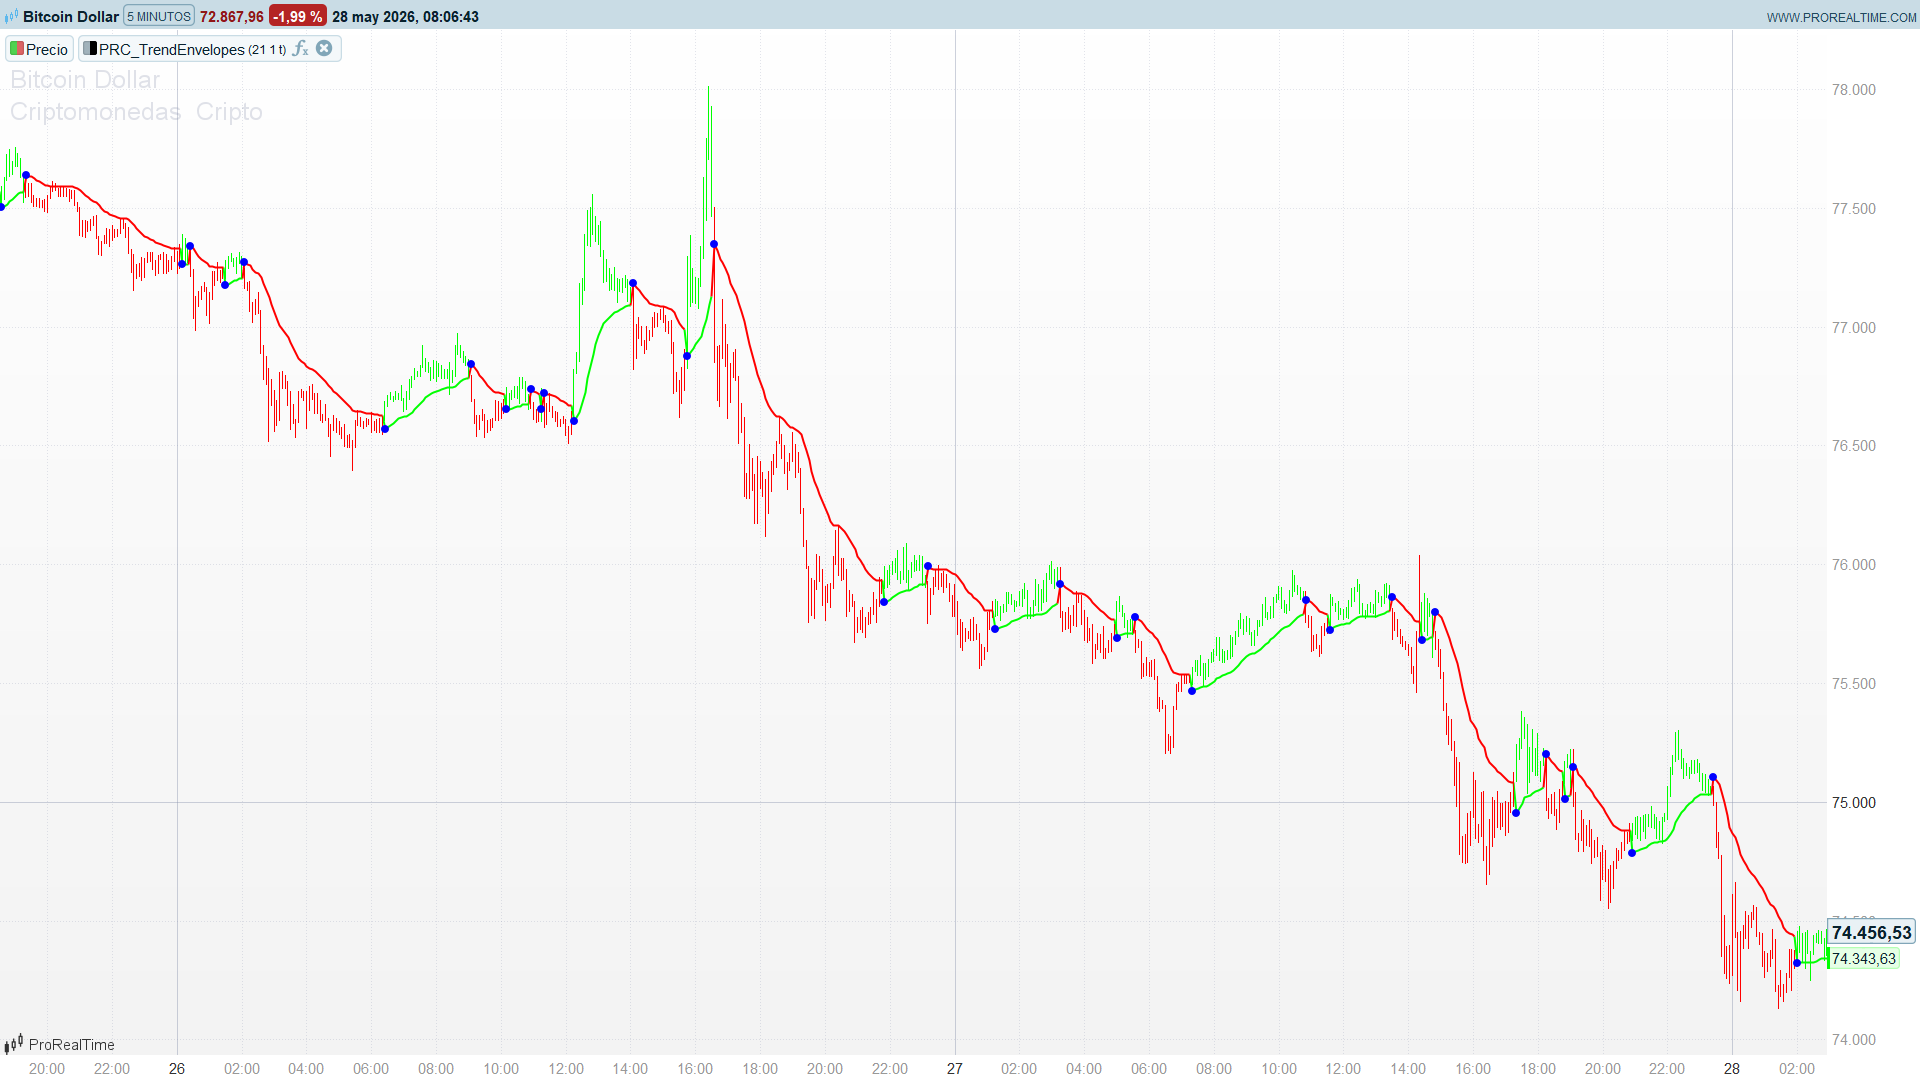
Trend Envelopes is a trend-following overlay that does three jobs with a single, compact piece of code: it tells you the dominant regime, it draws a trailing stop that never moves against you, and it prints a marker the moment the trend flips. The construction is deliberately simple — two moving averages, one of the highs and one of the lows — but the state machine wrapped around them turns that envelope into a latching trend filter that behaves much like a SuperTrend, without using ATR.
The idea is that the range of price (the gap between a high-MA and a low-MA) is itself a natural, self-scaling envelope. When candles are large the band widens; when the market calms down it tightens. Price closing above the upper band confirms a bullish regime, closing below the lower band confirms a bearish one, and everything in between is treated as noise that must not flip the trend.
Theory Behind the Indicator
The dual moving-average envelope
Instead of a single average of the close, the indicator builds two averages — one over the highs, one over the lows:
smax = average[period, type](high)   // upper band
smin = average[period, type](low)    // lower band
With type = 1 these are exponential moving averages of period 21. smax acts as a dynamic ceiling, smin as a dynamic floor. Because they track the extremes rather than the close, the band automatically reflects the recent trading range: it expands through volatile, wide-ranging bars and contracts during quiet consolidation. No volatility input (ATR, standard deviation) is needed — the high/low spread is the volatility proxy.
The latching trend state machine
The trend is a persistent state, not a bar-by-bar comparison:
close > smax[1]   ->   trend = +1   (bullish)
close < smin[1]   ->   trend = -1   (bearish)
otherwise         ->   trend stays unchanged
Two points make this robust:
- It uses the previous band value (
[1]). Comparing today’s close against yesterday’s band avoids the circularity of testing a band that already contains today’s high or low, and gives a clean, repaintless rule. - It only flips on the opposite band. Once bullish, the regime survives every dip that stays inside the envelope; only a decisive close below the lower band turns it bearish. This is the classic SuperTrend latch — it is what keeps the indicator from whipsawing on intrabar noise.
The ratcheting trailing stop
This is the part that gives the indicator its character. While the trend is up, the lower band is not allowed to fall; while the trend is down, the upper band is not allowed to rise:
trend > 0  and  smin < smin[1]   ->   smin = smin[1]   // floor only rises
trend < 0  and  smax > smax[1]   ->   smax = smax[1]   // ceiling only falls
Because the script reassigns the variable itself, the locked value is what [1] returns on the next bar — so the effect compounds: the floor ratchets up step by step in an uptrend and never retreats until the regime changes. The result is a true trailing stop, not just a moving average.
The elegant consequence is that the displayed trail and the invalidation level are one and the same. The bullish trend ends precisely when close < smin[1] — that is, when price closes below the same ratcheted floor the indicator has been drawing. You are never guessing where the stop is: it is the line on the chart.
The output trail, signals and colouring
The trail simply follows the active band, coloured by regime:
trend = +1   ->   mytrail = smin   (green line, below price)
trend = -1   ->   mytrail = smax   (red line, above price)
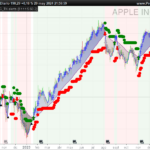
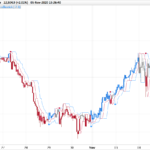
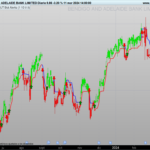
A blue dot is drawn the moment the trend changes (trend[1] <> trend), marking the bar where the regime flipped — the canonical entry trigger. Optionally (colorcandles = 1) the candles are repainted green in an uptrend and red in a downtrend, so the regime is readable at a glance.
How to Read the Indicator
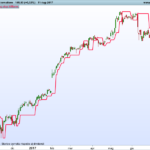
- Line position = regime. A green line sitting below price means a bullish trend is in force; a red line above price means bearish. The candle colour confirms the same state.
- The line is your stop. In an uptrend the green trail is a logical protective-stop level that only ratchets higher. The reverse holds in a downtrend. A close beyond it both stops you out and flips the regime.
- The blue dot is the signal. It appears on the first bar of a new regime — the place to consider an entry in the new direction, with the freshly drawn trail as the initial stop.
- Band width = conviction. A wide envelope reflects an energetic, wide-ranging market; a narrow one warns that a consolidation is compressing and a flip may be near.
Practical Applications
- Trailing stop for an existing position. Drop it on a trade you took for other reasons and let the ratcheting line manage the exit.
- Regime filter. Allow longs only while the trail is green, shorts only while red. The latch keeps the filter stable through pullbacks.
- Stand-alone reversal system. Enter on the blue dot, reverse on the opposite dot — a simple always-in trend-following model.
- Confirmation layer. Combine with a momentum oscillator (RSI, MACD) and take oscillator signals only in the direction of the envelope trend.
- Multi-timeframe alignment. Read the regime on the higher timeframe, take entries on the lower timeframe only while both agree.
Indicator Configuration
period – 21 – Lookback of both the high-MA and low-MA bands
type – 1 – MA type: 0 simple, 1 exponential, 2 weighted, 3 Wilder, …
colorcandles – 1 – Repaint candles by regime (1 on / 0 off)
A shorter period makes the envelope hug price and flip more often (more signals, more whipsaw); a longer one produces a smoother, slower trail with fewer but more reliable regime changes. Switching type to 0 (SMA) gives a steadier band, while higher-reactivity averages (WMA) tighten the trail at the cost of more flips.
Implementation Notes
A couple of details are worth flagging for anyone reading or adapting the source:
- Variable reassignment as a ratchet. Lines like
smin = smin[1]overwrite the current value of a series variable with its previous one. In ProBuilder this is a legitimate and idiomatic way to build a monotonic trailing level: because the new value becomes the[1]reference on the next bar, the lock persists for the whole duration of the regime. This is the same mechanism SuperTrend uses to “freeze” its stop. smax[1]/smin[1]for the flip test. Using the previous bar’s (already ratcheted) band rather than the raw EMA means the invalidation level tightens together with the trailing stop — the line you see is the line that flips the trend, with no look-ahead.onceinitialisation.once trend = undefinedandonce mytrail = undefinedseed the state once at the first bar; theelse trend = trendbranch then carries the state forward until a band is breached.
Code
//------------------------------------------------------------------//
//PRC_TrendEnvelopes
//version = 0
//19.06.2024
//Iván González @ www.prorealcode.com
//Sharing ProRealTime knowledge
//------------------------------------------------------------------//
//-----Inputs-------------------------------------------------------//
period=21
type=1
colorcandles=1
//------------------------------------------------------------------//
//-----Moving averages----------------------------------------------//
smax=average[period,type](high)
smin=average[period,type](low)
//------------------------------------------------------------------//
//-----Trend calculation--------------------------------------------//
once trend=undefined
if close > smax[1] then
   trend=1
elsif close < smin[1] then
   trend=-1
else
   trend=trend
endif
//------------------------------------------------------------------//
//-----Trail calculation--------------------------------------------//
once mytrail=undefined

if trend>0 and smin < smin[1] then
   smin=smin[1]
elsif trend<0 and smax > smax[1] then
   smax=smax[1]
endif

if trend=1 then
   mytrail=smin
   r=0
   g=255
   b=0
   if trend[1]<>1 then
      drawpoint(barindex,mytrail,2)coloured("blue")
   endif
elsif trend=-1 then
   mytrail=smax
   r=255
   g=0
   b=0
   if trend[1]<>-1 then
      drawpoint(barindex,mytrail,2)coloured("blue")
   endif
endif
//------------------------------------------------------------------//
//-----Color Candles------------------------------------------------//
if colorcandles then
   drawcandle(open,high,low,close)coloured(r,g,b)
endif
//------------------------------------------------------------------//
return mytrail coloured(r,g,b)style(line,2)