

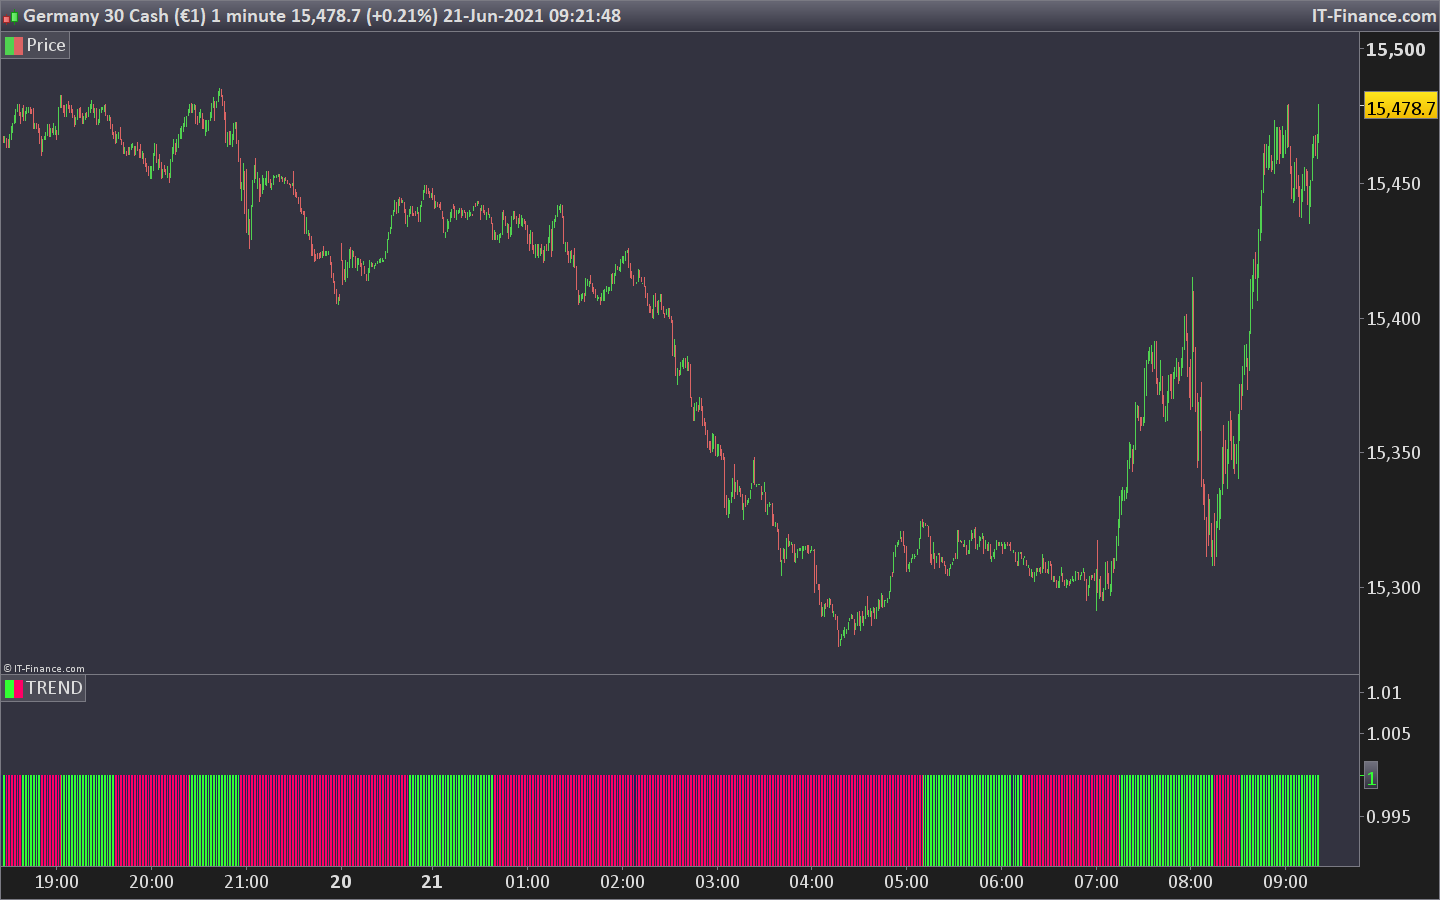
Trend Bar for trading bias
June 21, 2021, 9:23 AM
Indicators
0 Comments
Basic but visual indicator based on EMAs to determine trading direction/bias. Use with your preferred method of entry (TL break, Trend Candles, ASC Trend Arrows, etc) or else use with Multi TF, to detect when your lower TF is back in synch with your higher TF.
Please remember to use money management, backtest your strategy and trade responsibly. Thanks…
//PRC_Trend_Bar
//Craig - @Newbie PRC


//Visual indicator which works great in trending markets, or to determine a bias for diectional trading
//Add the indicator & Modify colours (unlinked) to your preference for long/short & modify "Style" to display as "histogram"

//When the trend is in your direction, employ your method of entry (STOCH, ASC Trend Arrow, Break of TL etc)
//Or use on multi-TF to detect when the smaller TF is back in synch with your higher TF direction for trades

//Remember money management, backtest your strategy & please trade responsibly - Thanks

//EMA SETTINGS
EMA20 = ExponentialAverage[20](close)
EMA50 = ExponentialAverage[50](close)
EMA100 = ExponentialAverage[100](close)

//CONDITIONS
LONG = EMA20 > EMA50 AND EMA20 > EMA100
SHORT = EMA20 < EMA50 AND EMA20 < EMA100

// EMA BAND
If LONG then
color1 = 1
Elsif SHORT then
color1 = -1
Endif
//END SETTINGS

//DISPLAY RETURNED IN THE BAR
Return  1 coloured by color1 as "TREND"
Download
Filename:
Trend-Bar-for-trading-bias.itf
Downloads:
229
Average
This author is like an anonymous function, present but not directly identifiable. More details on this code architect as soon as they exit 'incognito' mode.
Author’s Profile
Loading...