

Trench cross scalper
This indicator is an attempt of scalping strategy by crossing the mean high or low weigthed price over a short “n” period. This 2 lines represent the black “trench” on screenshots attached.
When signal line (white one) crossing the buy trigger one (dotted green one) a buy signal should occur and vice-versa for a sell signal (when crossing the dotted red one). I add an option to draw the white signal line as the close price value of the high/low ones if they are respectively above or below the trench’ buy or sell lines trigger.
The yellow green and red brick lines serve as stoploss.
The indicator can be use alone with no price chart as its values are derivated from it, of course if you dont mind about candlesticks informations.
I think enter/exit trades should occur very quickly, as it were designed for scalping trading purpose. I didn’t have much time to test it for a long period, so here it is as a concept indicator, despite that, it does have sense.
//parameters :
// n = 10
// useHL = true (boolean)

o=summation[n](open)
hh=summation[n](high)
ll=summation[n](low)
cc=summation[n](close)

sumH = ((o+hh+cc)/(3*n))
sumL = ((o+ll+cc)/(3*n))

slH = highest[n/2](high)
slL = lowest[n/2](low)

if(useHL) THEN
   if(high>sumH) THEN
     price = high
   ELSIF (low<sumL) THEN
     price = low
   ELSE
     price = close
   ENDIF
ENDIF

if(NOT useHL) THEN
price = close
ENDIF

RETURN sumH as "BUY trigger", sumL as "SELL trigger", slH as "SELL stoploss", slL as "BUY stoploss", price as "price"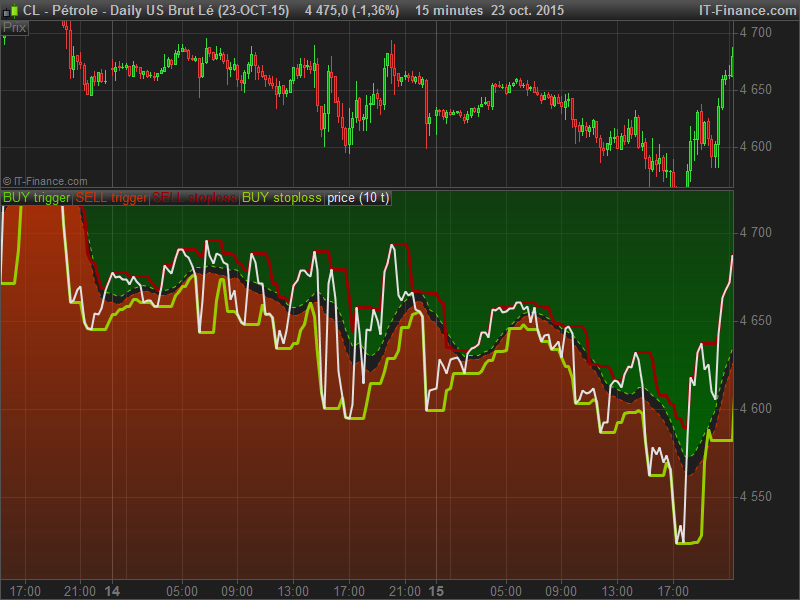