Transaction Volume Indicator

v10.3
Transaction Volume Indicator

For this indicator, I have assumed that the more market participants there are, the higher the volatility.

If the volatility is high, then the direction of the price is better.

During range phases, there are therefore logically fewer participants.

To highlight this point, I went to retrieve the information in trading units on 1Tick.
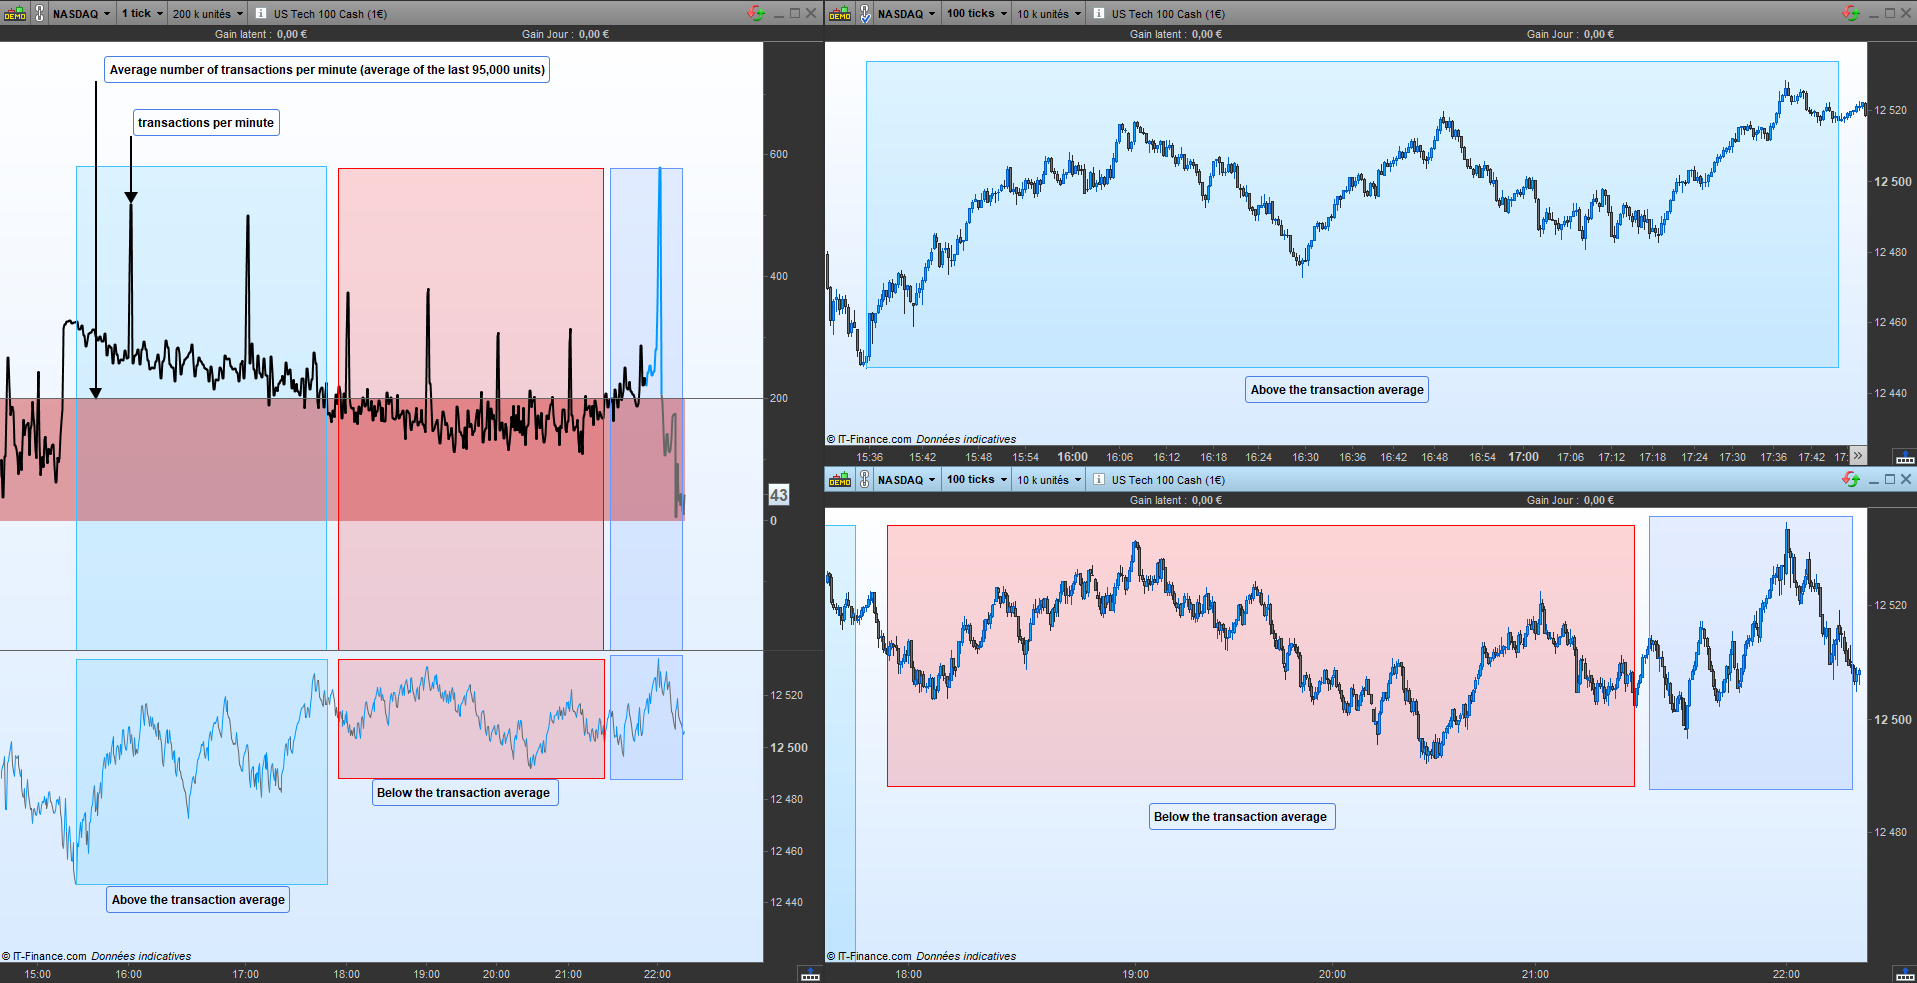
The indicator calculates the number of trades per minute and averages the last 95,000 units per minute.

If the number of transactions is lower than the average, we will see this type of graph in the red rectangle.

If the number of transactions is above the average, then the graph will be as in the blue rectangle.

We can see that the “Blue” phase is much more directional than the “Red” phase.

This indicator works only on 1Tick with 200 K of historical data.

I also provide this link to discuss this indicator with possible updates: https://www.prorealcode.com/topic/transaction-volume-indicator/


Share this

Risk disclosure:

No information on this site is investment advice or a solicitation to buy or sell any financial instrument. Past performance is not indicative of future results. Trading may expose you to risk of loss greater than your deposits and is only suitable for experienced investors who have sufficient financial means to bear such risk.

ProRealTime ITF files and other attachments : How to import ITF files into ProRealTime platform?

PRC is also on YouTube, subscribe to our channel for exclusive content and tutorials

  1. Rocketship • 12/07/2020 #

    Getting syntax error.

  2. IV Mcm • 12/07/2020 #

    For ProRealTime version 10.3, please delete on lines 79 and 82 the instruction “” bordercolor(0,0,0,0) “”.

  3. Suzu Yuk • 12/07/2020 #

    I did what you said…… However, it still does not work…

  4. Ichimoku Reading • 12/07/2020 #

    I don’t know in this case, I just downloaded it again and no problem for me.
    Try to download the last version, the code has been changed, maybe it will work

  5. Ichimoku Reading • 12/07/2020 #

    What’s the error that appears ?

  6. Suzu Yuk • 12/07/2020 #

    Yes, it worked with 1Tick with 200 K . Thank you very much.

avatar
Register or

Likes

avatar avatar avatar
Related users ' posts
Maxime Baudin Very useful! Thanks Mat, and Happy New Year
nicko Great work. Thank you. However I am having trouble getting it to print in the first bar. If ...
Marie-Eve Vergoz Bonsoir - Voici l'erreur qui est signalée lorsque je souhaite utiliser cet indicateur : il...
Meta Signals Pro Pleasure ! Please let us know if you make good trades with it and if you see improvements we...
francis59 Bonjour, Bonjour, comment puis-je créer un screener basé sur cet indicateur, qui affiche le...
Trader Sab I am curious to try it how, however I get an error message for line 47 and 48 - drawsegment,...
Om Hello, thanks for sharing! Getting a message that Variable P is undefined?
matin Intraday Average Volume Indicator Not working, what can i do plz
LucioleLucide Clean view, thanks for sharing
dertopen hi where i can found the window for candle configuration?
paolosab69 Ciao! . I have seen the pictures that explain this metod but i don't understand when is mome...
Ciccio
5 years ago
Vinks_o_7 Apirine also offers a very interesting update of the OBV...
TACBOLSA
5 years ago
dario ti please can you help me to understand? i know i am wrong: Long Histogram = High Volume S...
TAC Bolsa hi, I have already seen the problem and requested that it be removed until an adequate so...
sixeight Hey TAC, Did you ever find a solution to this?
Vinks_o_7 b=close > low and volume > high How can we compare volume and high of the day? (orang...
TAC Bolsa If to understand something you resort to compare Oranges and bananas. You go bad, Without e...
giumagi good morning Sir, great job your indicators! How can I reach your website or blog? please..t...
Gianluca THANK YOU!!!!!
JOSEBA que relaccion tiene la numeración de las barras del 1 al 10 que tiene cada número Tengo dos...
marcov66 Hi, it seems a very useful indicator. Unfortunately the link here for the full explanation d...
TACBOLSA Discontinued indicator. we are sorry.
Azzuerus Bonjour, je teste et j'utilise vos indicateurs depuis plusieurs années, et ils me sont dev...
bremze33 Another thing. Is it possible to make the graph lines a little thicker and not so long? Be...
giumagi Hi Sir, very good job done with this indicator, May I ask you to explain what is the line VW...
pmdr1969 Hola soy nuevo en en esto. ¿Hay algo parecido pero pudiendo tu elegir las velas a a analizar...
Nicolas Add indicator on price doesnt require any specific type of subcription. Click on the wrench ...
tahiti bonjour j'ai une petite question comment peux on enlevé la bar blanche sur la bougie en cour...
sixeight Hi Kris, is there a way to increase the number of rows? I get a loop error
Nicolas Good job Gabri, I confirm that with the new ProRealTime v11, everyone will be able to use in...
Slowlyslowly can u just help me with the exact definition of percbox , mm and period to understand will a...
Real Pro Great work gabri. I have this coded on Amibroker and I have done lots of backtesting but ne...
gabri Hi Real Pro, this indicator assists novices of the Wyckoff system. Wyckoff himself thought t...
tatie hi Gabri, I just came across the wyckoff method and was looking for the weiss wave indica...
Jesper Great share!

Top