







Trading Activity Index
Introduction
Zeiierman’s Trading Activity Index answers a deceptively simple question: is the market unusually busy right now, or unusually quiet — relative to its own recent history?
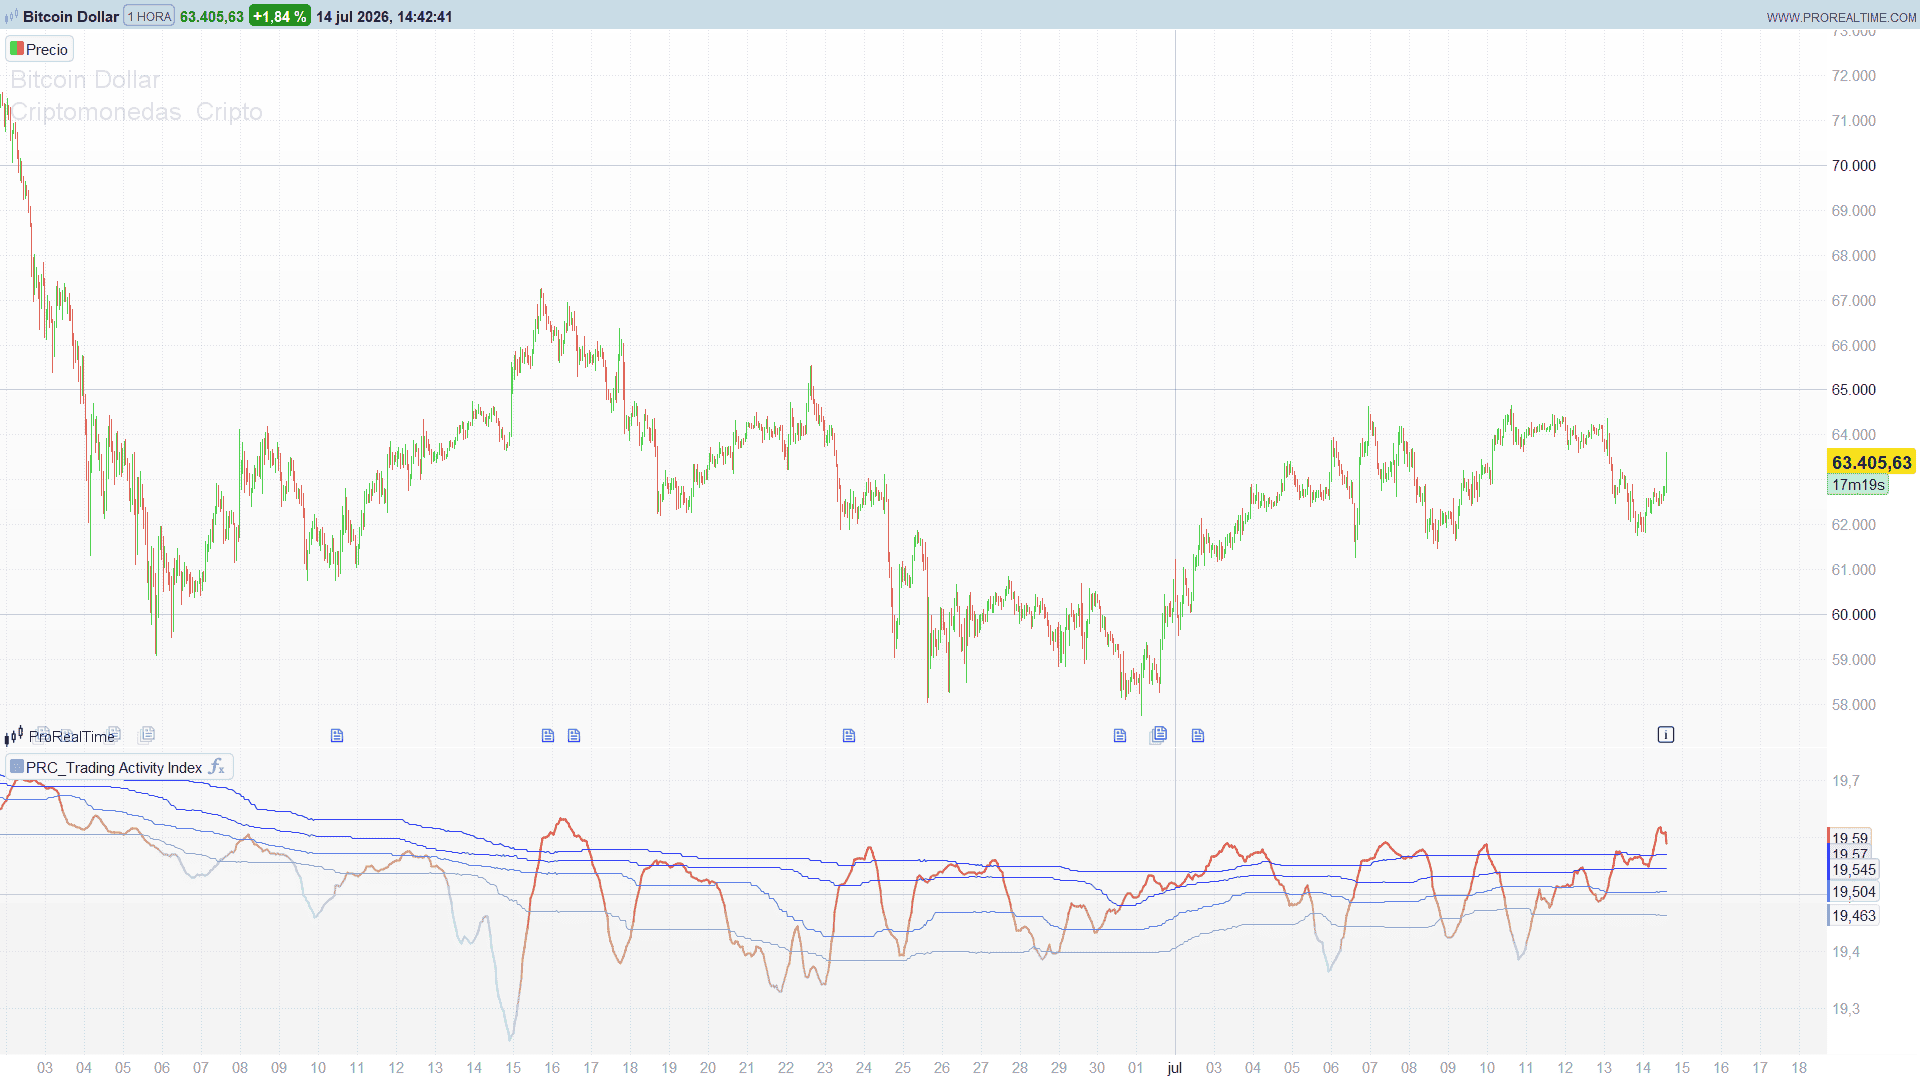
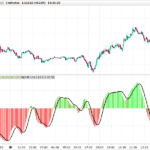
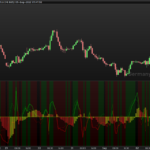
Plain volume cannot answer it well, because a fixed number of shares or contracts means very different things at different price levels, and because “busy” is only meaningful against a baseline. This indicator fixes both problems. It measures dollar volume (price times volume, a proxy for the capital changing hands), compresses it with a logarithm so the huge dynamic range becomes readable, and then ranks the result against a rolling window of its own past using percentile bands. The output is a clean sub-panel oscillator: one activity line coloured by a cool-to-warm gradient, and four quintile bands (P20/P40/P60/P80) that carve the panel into low-, normal- and high-activity zones.
Theory Behind the Indicator
1. Dollar volume — a better activity proxy
The engine never looks at raw volume. It builds:
dollarVolume = close × volume
A million shares trading at $5 and a million shares trading at $500 represent wildly different levels of participation; dollar volume captures that, raw volume does not. This is the same reasoning behind VWAP and behind most “smart money” flow tools: capital rotated, not units traded.
2. Log compression — making the range legible
Dollar volume spans several orders of magnitude across a session and across instruments. Plotted raw, it is a spiky mess dominated by a handful of outliers. The indicator averages it over a short formation window (20 bars) and takes the natural logarithm:
VOLSCALE = log( max( SMA(dollarVolume, 20), 1e-10 ) )
The max(…, 1e-10) is a floor that keeps the logarithm defined when volume is zero (dead bars, pre-market). The log turns a multiplicative quantity into an additive, roughly-stationary line — the blue-to-orange series you actually read. This is the “Trading Activity” plot.
3. Percentile bands — ranking activity against its own history
A value of VOLSCALE means nothing in isolation. Is 18.4 high? Only the instrument’s own history can say. So over a longer history window (252 bars) the indicator computes the 20th, 40th, 60th and 80th percentiles of VOLSCALE and draws them as four bands. They split the panel into quintiles of activity:
- Below P20 — unusually quiet; the market is ignoring this instrument.
- P20–P80 — normal range of participation.
- Above P80 — unusually busy; a spike in capital rotation, often around news, breakouts or institutional repositioning.
Because the bands are rolling percentiles, they adapt to the regime: a stock that gets structurally more liquid sees all four bands drift up, and “high activity” is re-based automatically. No fixed thresholds.
4. The colour gradient — regime at a glance
The activity line is coloured by rank01, the min-max normalised position of VOLSCALE inside the window:
rank01 = clamp( (VOLSCALE − min) / (max − min), 0, 1 )
colour = lerp( lightBlue(173,216,230) → redOrange(255,69,0), rank01 )
Cool blue when activity sits near the window’s floor, warm orange/red as it approaches the ceiling. The colour and the band position tell the same story two ways, which makes the read instantaneous.
The engineering problem: four rolling percentiles without a percentile function
This is where the translation earns its keep. Pine computes each band with ta.percentile_linear_interpolation(VOLSCALE, 252, P). ProBuilder has no percentile primitive, and the obvious workarounds are expensive:
- Bisection (discretise the value range into ~100 steps, count how many samples fall below each step): about 100 × 252 ≈ 25,200 operations per band, so ~100,000 per bar for four bands.
- k-th smallest by counting (for each candidate, count how many samples are ≤ it): O(N²) ≈ 63,500 operations per bar.
Either one, run on every bar of an intraday history, is the kind of load that makes ProRealTime crawl.
The port uses a histogram instead, and computes all four percentiles in essentially one pass over the window:
- Find the window’s min and max (one loop — reused for the colour gradient, so it is free).
- Slot every one of the 252 values into one of 100 bins: bin = floor((value − min) / binWidth). One loop over the window.
- Walk the bins once, accumulating a running count (the empirical CDF). The first bin where the cumulative fraction crosses 0.20 gives P20, 0.40 gives P40, and so on — all four in a single sweep.
Total cost is roughly N + 3·bins ≈ 700 operations per bar — about 35× cheaper than bisection, and it does not get worse if you enlarge the history window (the expensive part is the single O(N) binning pass, independent of the number of bands or bins). This is the canonical way to extract multiple quantiles at once, and it is the right tool the moment N gets large.
What was approximated, and why it does not matter
The histogram returns each percentile by inverse empirical CDF at a resolution of (max − min) / 100, whereas Pine’s percentile_linear_interpolation interpolates linearly between the two nearest ranks. With 252 samples the two disagree by less than one position out of 252 — a difference far thinner than the bands’ own line width. If you ever wanted it tighter, raising the bin count (say to 200) halves the resolution error and costs almost nothing, because it only lengthens the cheap O(bins) loops, never the O(N) binning pass. It is an honest, documented approximation, not a silent shortcut — and visually the bands are indistinguishable from the original.
Key Features at a Glance
- Dollar-volume base:
close x volume, capital rotated rather than raw units traded. - Log compression: natural log of a 20-bar average; tames the dynamic range into a readable line.
- Percentile bands: rolling P20/P40/P60/P80 over 252 bars; regime-adaptive quintiles of activity.
- Colour gradient: cool blue (quiet) to warm orange/red (busy), driven by the min-max rank.
- Sub-panel oscillator: separate panel; one activity line plus four reference bands.
How to Read the Indicator
- The activity line is the log-scaled dollar-volume flow. Rising = capital rotation increasing; falling = the market losing interest. Its colour reinforces the level: warm = active, cool = quiet.
- The bands are context. The line crossing above P80 flags unusually high activity — the fuel behind genuine breakouts and trend legs. The line sinking below P20 flags dead conditions, where breakouts are more likely to fail for lack of participation.
- Regime shifts show up as the line migrating from the lower quintiles into the upper ones (or vice versa) and holding there — an activity expansion or contraction, not a one-bar spike.
Practical Applications
- Breakout confirmation. Take price breakouts only when the activity line is in the upper quintile (above P60/P80). A breakout on sub-P20 activity is a low-conviction move.
- Filter for mean-reversion. Fade extensions preferentially in quiet regimes (line below P40), where there is no participation to sustain a trend.
- Session / instrument screening. Because the bands are self-normalising, the same “above P80” rule flags unusual activity consistently across instruments and timeframes — a natural building block for an “unusual volume” screener.
- Confluence. Combine a warm, above-P80 activity read with your own structure or momentum tools; treat cool, sub-P20 readings as a caution flag on any signal.
Indicator Configuration
The indicator ships as a single sub-panel script (the original is overlay=false, so nothing goes on the price chart).
lenForm(default 20): Formation window, the number of bars averaged before the log is taken.lenHist(default 252): History window, the bars used for the rolling percentiles and the colour range.nBins(default 100): Histogram resolution for the percentiles. Implementation detail, not in the original; higher is finer at negligible extra cost.
Code
//----------------------------------------------
//PRC_Trading Activity Index Zeiierman
//version = 0
//14.07.26
//Ivan Gonzalez @ www.prorealcode.com
//Traducido de "Trading Activity Index (Zeiierman)" (PineScript v6)
//Autor original: Zeiierman
//Sharing ProRealTime knowledge
//----------------------------------------------
// --- Parametros (ajustables en el panel del indicador) ---
lenForm = 20     // Formation Window (barras): promedio del dollar volume
lenHist = 252    // History Window (barras): percentiles y bandas
nBins = 100      // Resolucion del histograma de percentiles
//----------------------------------------------
// --- Dollar Volume medio y VOLSCALE (log) ---
//----------------------------------------------
dv = close * volume
dlrVolAvg = average[lenForm](dv)
vscale = log(max(dlrVolAvg, 0.0000000001))
//----------------------------------------------
// --- Defaults (warmup) ---
//----------------------------------------------
p20 = undefined
p40 = undefined
p60 = undefined
p80 = undefined
rMain = 173
gMain = 216
bMain = 230
//----------------------------------------------
validStart = lenForm - 1
if barindex >= validStart then
    neff = min(lenHist, barindex - validStart + 1)
    // --- Min / Max de la ventana (color y escala del histograma) ---
    vMin = vscale
    vMax = vscale
    for i = 0 to neff - 1 do
        if vscale[i] > vMax then
            vMax = vscale[i]
        endif
        if vscale[i] < vMin then
            vMin = vscale[i]
        endif
    next
    // --- rank01 -> color gradiente de la linea principal ---
    if vMax > vMin then
        rank01 = (vscale - vMin) / (vMax - vMin)
        if rank01 < 0 then
            rank01 = 0
        endif
        if rank01 > 1 then
            rank01 = 1
        endif
    else
        rank01 = 0.5
    endif
    rMain = round(173 + 82 * rank01)
    gMain = round(216 - 147 * rank01)
    bMain = round(230 - 230 * rank01)
    // --- Percentiles P20/P40/P60/P80 por histograma O(N + bins) ---
    if vMax > vMin then
        stepf = (vMax - vMin) / nBins
        for b = 0 to nBins do
            $bc[b] = 0
        next
        for m = 0 to neff - 1 do
            idx = floor((vscale[m] - vMin) / stepf)
            if idx < 0 then
                idx = 0
            endif
            if idx > nBins - 1 then
                idx = nBins - 1
            endif
            $bc[idx] = $bc[idx] + 1
        next
        p20 = vMin
        p40 = vMin
        p60 = vMin
        p80 = vMin
        d20 = 0
        d40 = 0
        d60 = 0
        d80 = 0
        cum = 0
        for s = 0 to nBins do
            fr = cum / neff
            testv = vMin + stepf * s
            if d20 = 0 and fr >= 0.2 then
                p20 = testv
                d20 = 1
            endif
            if d40 = 0 and fr >= 0.4 then
                p40 = testv
                d40 = 1
            endif
            if d60 = 0 and fr >= 0.6 then
                p60 = testv
                d60 = 1
            endif
            if d80 = 0 and fr >= 0.8 then
                p80 = testv
                d80 = 1
            endif
            if s < nBins then
                cum = cum + $bc[s]
            endif
        next
    else
        p20 = vMin
        p40 = vMin
        p60 = vMin
        p80 = vMin
    endif
endif
//----------------------------------------------
return vscale as "Trading Activity" coloured(rMain, gMain, bMain, 255) style(line, 2), p20 as "P20" coloured(138, 173, 235, 255), p40 as "P40" coloured(104, 130, 240, 255), p60 as "P60" coloured(69, 86, 245, 255), p80 as "P80" coloured(35, 43, 250, 255)
Comments
You must be logged in to post a comment.

Bonjour, J'ai trouvé le problème. L'indicateur utilise le volume (close * volume), et sur un instrument sans volume ou avec des trous de données, ce calcul devient « indéfini » ; cette valeur indéfinie arrivait jusqu'à l'index de l'histogramme, d'où le message « un entier positif est attendu ». Ce n'était donc pas une erreur de compilation mais de données, c'est pourquoi elle ne se produisait pas chez moi.
ce qui serait intéressant c'est de pouvoir filtrer les close*volume hors de certains horaires. le problème du volume, si l'on ne filtre pas c'est que l'on a un biais hérité des horaires hors marché. Soit les ignorer, soit affecter une pondération compensant la baisse de volume. à 5h du matin un volume x sur le dow n'a pas le même impact qu'un volume x à 15h30; énorme pour le premier, faible pour le second. j'ai souvent le problème en stratégies; généralement je le lisse avec un ratio volume normal, volume courant avec des moyennes mobiles longues de volume en fonction des horaires.
Voici la version corrigée : elle ignore désormais les barres sans volume et calcule les percentiles uniquement à partir des données valides