TMMS oscillator (Trading Made More Simpler)

TMMS oscillator (Trading Made More Simpler)

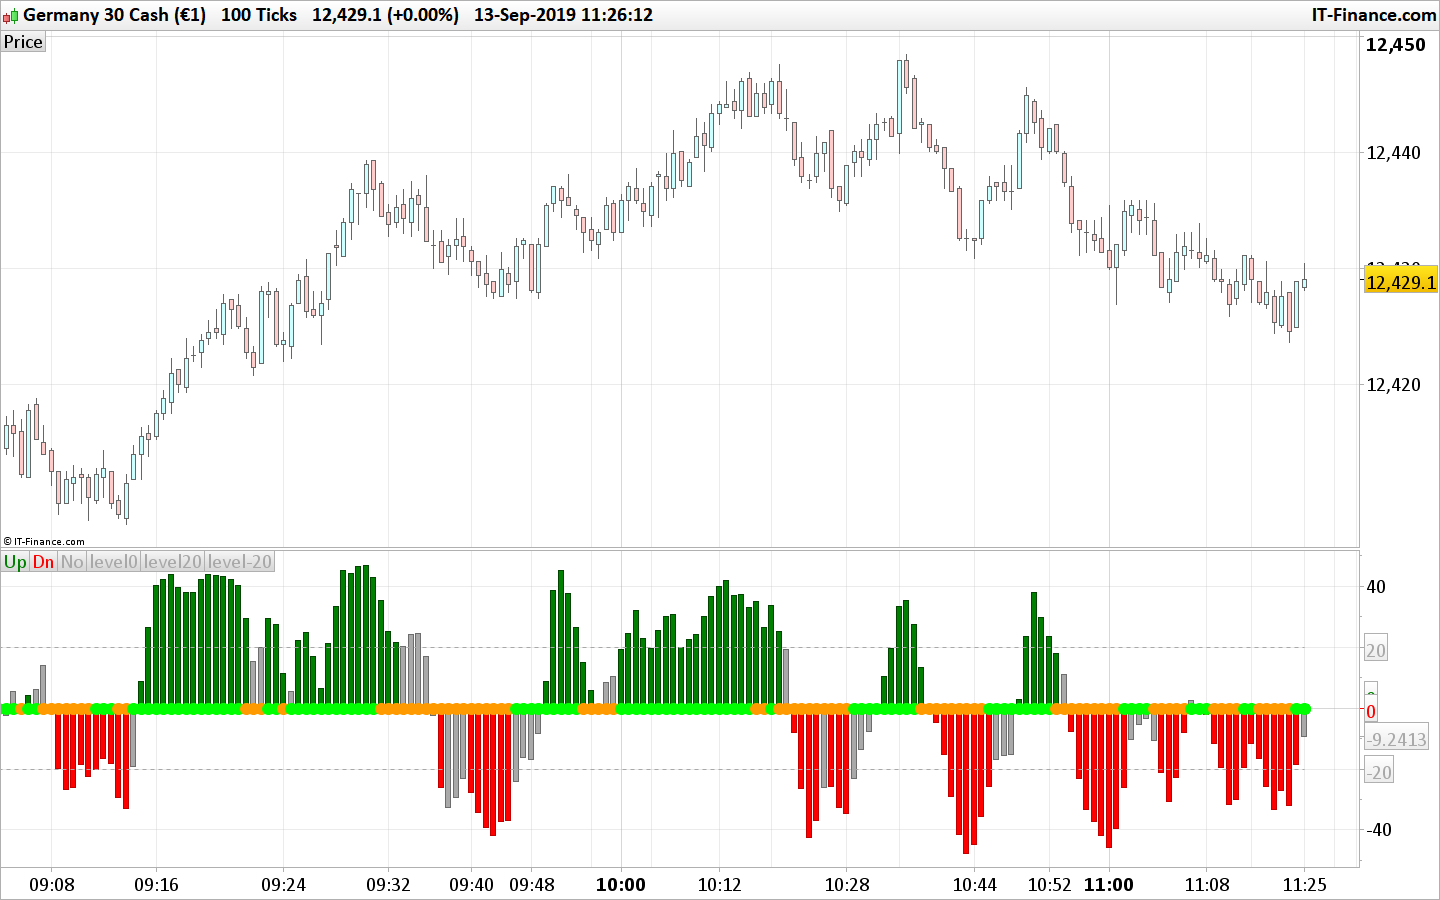
The TMMS oscillator (aka “Trading Made More Simpler”) is an indicator made of conditions based on both 2 separated Stochastic and 1 RSI.

Bullish zone is green and bearish one is red. When the histogram is grey, no signals is available at that time.

The indicator has an option to show the current trend of an Hull moving average (ascending or descending curve). When the trend is up, green dots are plotted on the zero line. When the trend is down, the dots are coloured in orange.

Indicator converted from an MT4 version by a request in the indicators forum.


Share this

Risk disclosure:

No information on this site is investment advice or a solicitation to buy or sell any financial instrument. Past performance is not indicative of future results. Trading may expose you to risk of loss greater than your deposits and is only suitable for experienced investors who have sufficient financial means to bear such risk.

ProRealTime ITF files and other attachments : How to import ITF files into ProRealTime platform?

PRC is also on YouTube, subscribe to our channel for exclusive content and tutorials

  1. Teddy Coronak • 09/13/2019 #

    Merci Nicolas pour ce travail !!!
    Toujours aussi simple et efficace.

  2. rigel • 09/13/2019 #

    Thanks a lot Nicholas, also liked very much the description of it use

  3. f1_maik • 09/13/2019 #

    Thank you so much.
    Is it possible to rewrite the Indicator to a program? What would this look like?

    • Nicolas • 09/13/2019 #

      Do you mean an automated trading system?

    • f1_maik • 09/13/2019 #

      Yes. I would be fine and brings help with a backtest.

    • Nicolas • 09/13/2019 #

      Please open a topic in the automatic trading forum for that and bring sufficient explanation on how it should behaves (entries, exit, ..). Thanks in advance.

    • f1_maik • 09/13/2019 #

      Yes, I’d like to.
      But I don’t know when I want to choose to leave or join. When the histogram turns green? When an orange dot appears?
      That’s why I ask for a system. Only the indicator is of little use to me.

  4. Maxime Baudin • 09/13/2019 #

    Thank you Nicolas!

  5. Balmora74 • 09/13/2019 #

    Thanks a lot Nicolas. Fantastic indicator !!!!! Wawaouhh !!!

  6. Marcelo Tevrizian • 09/13/2019 #

    Anyone has rewritten this to Ninja? I am working on it but it will take some time. Thanks.

  7. Cedlam • 09/13/2019 #

    Qu’est ce que j’aimerais savoir faire ça !!!!!
    Merci beaucoup Nicolas.

  8. sally31120 • 09/13/2019 #

    Bonjour Nicolas,
    C’est indicateur semble très intéressant mais je n’ai pas les compétences pour l’exploiter.
    Serait-il possible de connaitre le code pour en faire des screeners
    1) Passage du point orange en point vert
    2) Point vert avec passage histogramme gris > 0
    3) Point vert avec passage histogramme vert > 0
    Merci d’avance

    • Nicolas • 09/13/2019 #

      Merci de formuler une demande dans le forum des screeners.

  9. overspin • 09/13/2019 #

    Bonjour Nicolas, avez vous déjà essayé de mettre une alerte PRT au passage du zéro avec cet indicateur, en ce qui me concerne cela n’est pas possible, même en créant une ligne (zéro) et programmant le UP ou DOWN a = zéro ? merci d’avance pour votre réponse

  10. scarphace38 • 09/13/2019 #

    Bonjour,
    Merci Nicolas pour tout ce travail. Je n’arrive pas a avoir le même graphique que toi.
    Voici ce que j’ai :

    Que faut il faire et modifier ?
    Encore Merci

  11. rosario • 09/13/2019 #

    salut Nicolas, je voudrais vous demander pourquoi sur mon pro en temps réel cet oscillateur très intéressant n'apparaît pas?
    merci

    • Nicolas • 09/13/2019 #

      je ne sais pas, il fonctionne correctement pour moi. Il ne faut pas l’appliquer sur le prix, mais utiliser le bouton des indicateurs.

  12. rosario • 09/13/2019 #

    Merci pour la réponse, je l’utilise comme indicateur, mais les colonnes lorsque le prix est positif (les vertes au dessus de zéro) ne sortent pas. En dessous de zéro, les barres négatives sortent à la fois des rouges et des grises.
    cordialité

    • Nicolas • 09/13/2019 #

      C’est curieux, merci d’ouvrir un sujet sur le forum et de produire des copies d’écran.

  13. Morris59 • 09/13/2019 #

    Hallo Nicholas,
    tks very much for your work, I’m a rookie in the world of indicators and oscillators,
    I’m happy to use this and i’m shure worked well togheter experience and other tool,
    please if I want increase “aggressive” (10%) in this tool whick parameters I must change,
    tks and I’m sorry for my bad english
    Maurizio (Mi-Italy)

avatar
Register or

Likes

avatar avatar avatar avatar avatar avatar avatar avatar avatar avatar avatar avatar avatar avatar avatar avatar

+25 more likes

Related users ' posts
adeelq79 Great work Ivan. Thanks
Quino Another really interesting indicator. It works very well on periods below 25. Just a few cos...
supertiti hola Ivan Eso quiere decir que el Parabolic sar RSI est igual al parabolic sar de PRT ? p...
supertiti buenas tardes Ivan me gusteria tener lo mismo on chart con los puntos azules y rosas de c...
LucasBest Thanks for the translation. This one can be compared to dynamic zone RSI
Iván
1 month ago
Iván Sorry... There is a mistake in line 76. Should be if openday[i]openday[i+1] then
DLVx You do not specify how to read the Calmar ratio. Above 1 is OK and 0 is neutral? Can you she...
lee HI thank you for this indicator. Is it possible to create a screener based on this for when ...
xpe74 Hello it seems the file format does not allow to import the file. At importation stage, an e...
Iván You always can copy/paste directly from the post
roccafragius Thank you so much, for my point of view very useful!!!
NicoGB67 Excelente trabajo!!
Jrmjrm Bonsoir est-il possible d'avoir cet indicateur, mais à la place du Wilder Average, utiliser ...
geroniman merci Ivan, super indicatuer. Les cours vont souvent toucher 50% des zones vertes ou rouges....
Iván Pour ajouter une ligne supplémentaire, il suffit de créer une nouvelle variable, par exemple...
Maurizio A. excellent indicateur ! comment puis-je modifier le code pour afficher uniquement les dernier...
Iván Hi! just change line13 for this: showsignals=1
Quino Hi Excellent indicator as usual. Just 2 questions: Why LenH and LenL = 15 as Len could be...
Iván Hi! good question. This is a code request traslation from other platform. I took same inputs...

Top