

TKP T3 Trend With Psar Barcolor
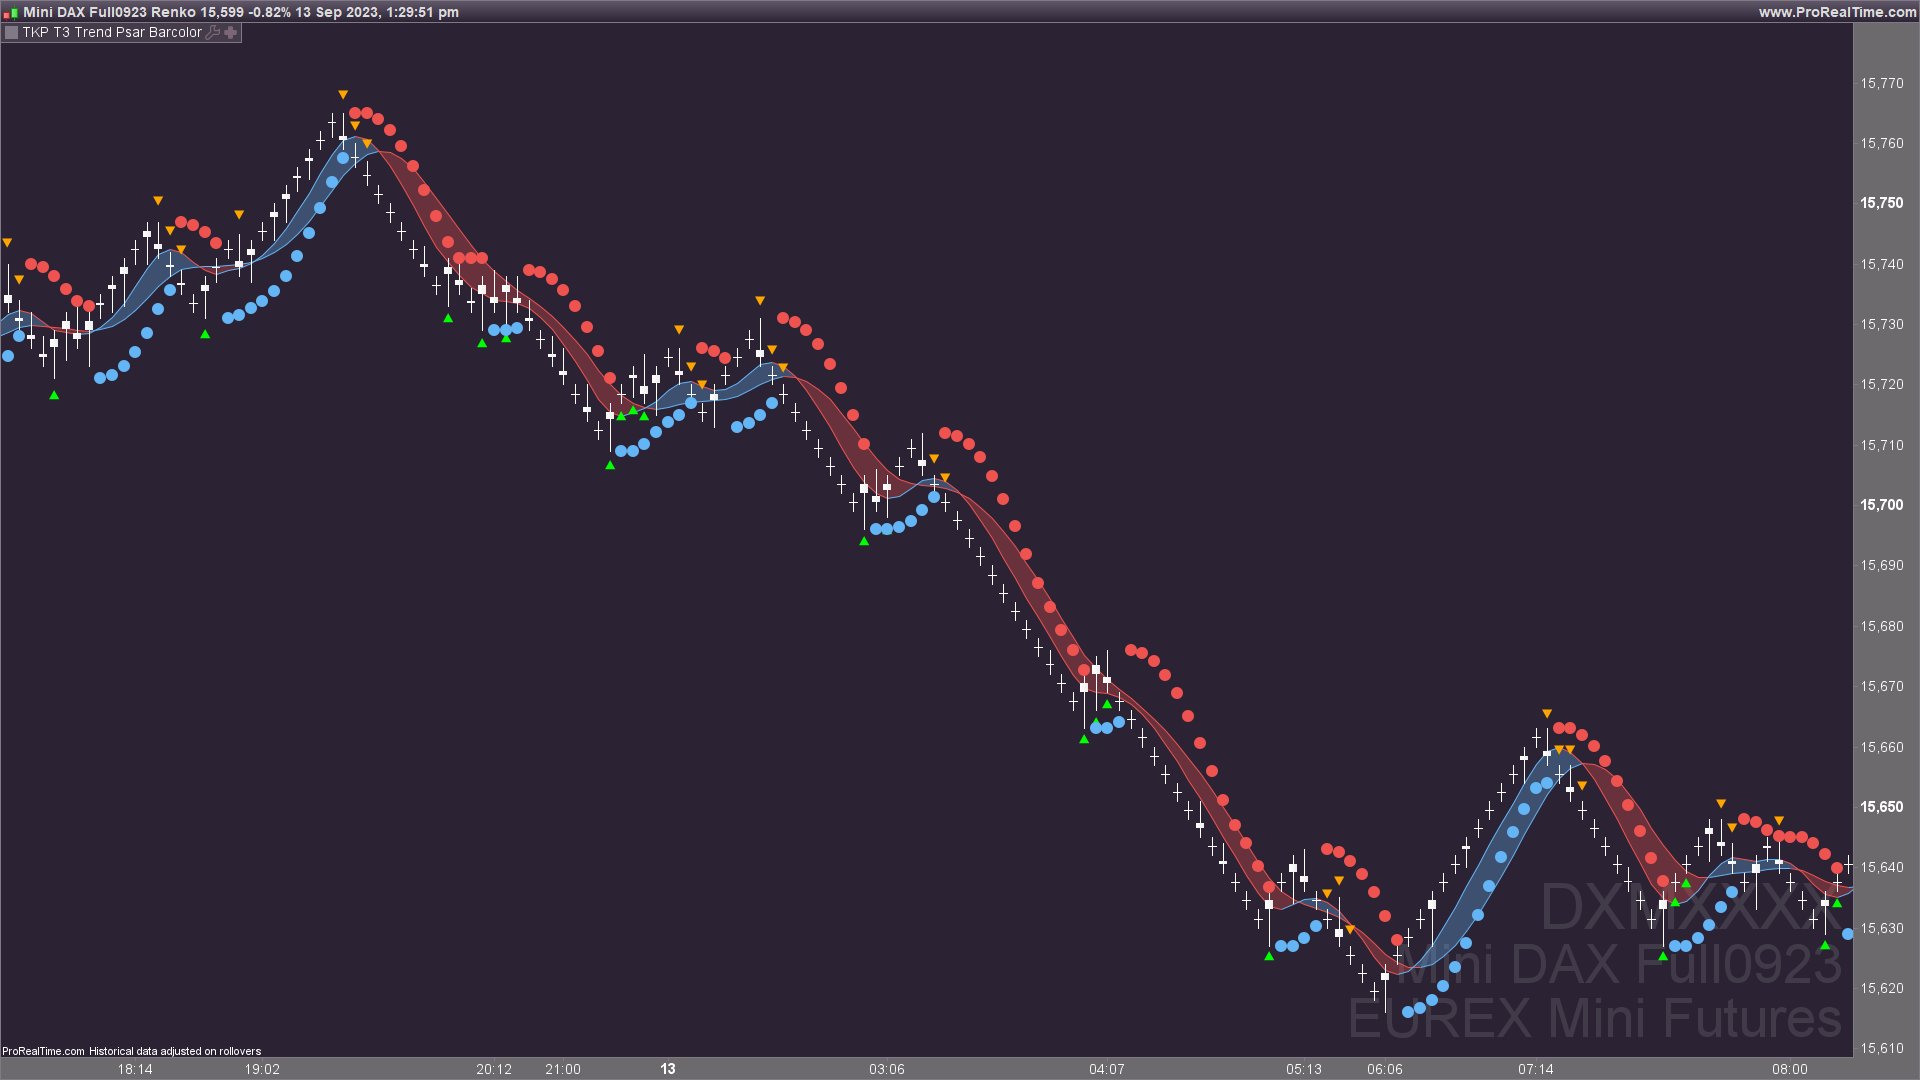
This indicator is intended to help identify reversals and attempt to anticiapate them.
Bull trends are identified by blue bars, while bear trades are identified by red. Points of reversal are indicated with yellow candles. //Bars change to yellow as bar close crosses the Tilson moving averages. Blue or red is confrimed as the two Tilson avergaes themselves cross.
Buy and sell signal is given on yellow bars
Psar helps identify reversals and provide stop loss values
Arrows appear above or below candles to incorporate a momentum aspect. This condition is based on a rising or falling TSI value while under or over the signal line. This can show momentum ‘headwinds’ or ‘tailwinds’ as TSI ‘curls’.
Description from original author: Bjorgum
//this script is intended to help identify reversals and attempt to anticiapate them. Psar and Tilson templates are from Chris Moody and TKP Trader
//@Bjorgum on Stocktwits
//Bull trends are identified by blue bars, while bear trades are identified by red. Points of reversal are indicated with yellow candles.
//Bars change to yellow as bar close crosses the Tilson moving averages. Blue or red is confrimed as the two Tilson avergaes themselves cross.
//Buy and sell signal is given on yellow bars
//TURN CANDLE BORDERS OFF
//Psar helps identify reversals and provide stop loss values
//Arrows appear above or below candles to incorporate a momentum aspect. This condition is based on a rising or falling TSI value while under or over the signal line.
//This can show momentum 'headwinds' or 'tailwinds' as TSI 'curls'.

// TSI Inputs
long = 25
short = 5
signal = 14
// --------------------

// Calculate TSI
pc = close - close[1]

// Calculate double smoothed PC
firstsmooth = ExponentialAverage[long](pc)
doublesmoothedpc = ExponentialAverage[short](firstsmooth)

// Calculate double smoothed absolute PC
abspc = abs(pc)
firstsmoothabs = ExponentialAverage[long](abspc)
doublesmoothedabspc = ExponentialAverage[short](firstsmoothabs)

tsivalue = 100 * (doublesmoothedpc / doublesmoothedabspc)

// Calculate Signals
data = tsivalue > tsivalue[1] AND tsivalue < ExponentialAverage[signal](tsivalue)
dtat = tsivalue < tsivalue[1] AND tsivalue > ExponentialAverage[signal](tsivalue)

// Define ATR
atr = AverageTrueRange[14](close)

// Plot Upward-Pointing Triangle using drawtext for "Curl Up" with color "green"
IF data THEN
DRAWTEXT("▴", barindex, low - atr / 2, dialog, bold, 25) coloured(0, 255, 0, 255)
ENDIF

// Plot Downward-Pointing Triangle using drawtext for "Curl Down" with color "orange"
IF dtat THEN
DRAWTEXT("▾", barindex, high + atr / 2, dialog, bold, 25) coloured(255, 165, 0, 255)
ENDIF

// Parabolic Stop and Reverse
startValue = 0.043
incrementValue = 0.043
maximumValue = 0.34

// Calculate PSAR
sarUp = SAR[startValue, incrementValue, maximumValue]
sarDown = SAR[startValue, incrementValue, maximumValue]

// Define Colors
colUpR = 100
colUpG = 181
colUpB = 246

colDownR = 239
colDownG = 83
colDownB = 80

// Condition to check if close is greater or equal to sarDown
IF close >= sarDown THEN
DRAWPOINT(barindex, sarUp, 3) coloured(colUpR, colUpG, colUpB, 255)
ENDIF

// Condition to check if close is less or equal to sarUp
IF close <= sarUp THEN
DRAWPOINT(barindex, sarDown, 3) coloured(colDownR, colDownG, colDownB, 255)
ENDIF

// T3 MA5
aLength = 5
AxPrice = close
axe1 = ExponentialAverage[aLength](AxPrice)
axe2 = ExponentialAverage[aLength](axe1)
axe3 = ExponentialAverage[aLength](axe2)
axe4 = ExponentialAverage[aLength](axe3)
axe5 = ExponentialAverage[aLength](axe4)
axe6 = ExponentialAverage[aLength](axe5)
ab = 0.7
ac1 = -ab * ab * ab
ac2 = 3 * ab * ab + 3 * ab * ab * ab
ac3 = -6 * ab * ab - 3 * ab - 3 * ab * ab * ab
ac4 = 1 + 3 * ab + ab * ab * ab + 3 * ab * ab
anT3Average = ac1 * axe6 + ac2 * axe5 + ac3 * axe4 + ac4 * axe3
p2 = anT3Average

colOne = anT3Average > anT3Average[1]
colTwo = anT3Average < anT3Average[1]

IF colOne THEN
T3ColorR = 100
T3ColorG = 181
T3ColorB = 246
ELSIF colTwo THEN
T3ColorR = 239
T3ColorG = 83
T3ColorB = 80
ELSE
T3ColorR = undefined
T3ColorG = undefined
T3ColorB = undefined
ENDIF

// T3 MA8
Length = 8
xPrice = close
xe1 = ExponentialAverage[Length](xPrice)
xe2 = ExponentialAverage[Length](xe1)
xe3 = ExponentialAverage[Length](xe2)
xe4 = ExponentialAverage[Length](xe3)
xe5 = ExponentialAverage[Length](xe4)
xe6 = ExponentialAverage[Length](xe5)
b = 0.7
c1 = -b * b * b
c2 = 3 * b * b + 3 * b * b * b
c3 = -6 * b * b - 3 * b - 3 * b * b * b
c4 = 1 + 3 * b + b * b * b + 3 * b * b
nT3Average = c1 * xe6 + c2 * xe5 + c3 * xe4 + c4 * xe3
p1 = nT3Average

upCol = nT3Average > nT3Average[1]
downCol = nT3Average < nT3Average[1]

IF upCol THEN
myColorR = 100
myColorG = 181
myColorB = 246
ELSIF downCol THEN
myColorR = 239
myColorG = 83
myColorB = 80
ELSE
myColorR = undefined
myColorG = undefined
myColorB = undefined
ENDIF

// T3 area fill
fillData = nT3Average < anT3Average
fillDtat = nT3Average > anT3Average

IF fillData THEN
FillColorR = 100
FillColorG = 181
FillColorB = 246
ELSIF fillDtat THEN
FillColorR = 239
FillColorG = 83
FillColorB = 80
ELSE
FillColorR = undefined
FillColorG = undefined
FillColorB = undefined
ENDIF

COLORBETWEEN(nT3Average, anT3Average, FillColorR, FillColorG, FillColorB, 80)

// Heikin-Ashi Bar Input
haClose = (open + high + low + close) / 4
haOpen = (open + close) / 2
IF NOT haOpen[1] = undefined THEN
haOpen = (haOpen[1] + haClose[1]) / 2
ENDIF
haHigh = MAX(high, MAX(haOpen, haClose))
haLow = MIN(low, MIN(haOpen, haClose))

// Define colors
BullTrendColorR = 100
BullTrendColorG = 181
BullTrendColorB = 246

BearTrendColorR = 239
BearTrendColorG = 83
BearTrendColorB = 80

BullReversalColorR = 255
BullReversalColorG = 241
BullReversalColorB = 118

BearReversalColorR = 255
BearReversalColorG = 241
BearReversalColorB = 118

// Bar Color
uc = (close > nT3Average) AND (anT3Average >= nT3Average)
dc = (close < nT3Average) AND (anT3Average <= nT3Average)
dr = (close < nT3Average) AND (anT3Average >= nT3Average)
ur = (close > nT3Average) AND (anT3Average <= nT3Average)

hauc = (haClose > nT3Average) AND (anT3Average >= nT3Average)
hadc = (haClose < nT3Average) AND (anT3Average <= nT3Average)
hadr = (haClose < nT3Average) AND (anT3Average >= nT3Average)
haur = (haClose > nT3Average) AND (anT3Average <= nT3Average)

hadu = haClose >= haOpen
hadd = haClose < haOpen

IF uc THEN
BarColorR = BullTrendColorR
BarColorG = BullTrendColorG
BarColorB = BullTrendColorB
ELSIF dc THEN
BarColorR = BearTrendColorR
BarColorG = BearTrendColorG
BarColorB = BearTrendColorB
ELSIF dr THEN
BarColorR = BearReversalColorR
BarColorG = BearReversalColorG
BarColorB = BearReversalColorB
ELSIF ur THEN
BarColorR = BullReversalColorR
BarColorG = BullReversalColorG
BarColorB = BullReversalColorB
ELSE
BarColorR = undefined
BarColorG = undefined
BarColorB = undefined
ENDIF

// Heikin-Ashi Bar Color
IF hauc THEN
HABarColorR = BullTrendColorR
HABarColorG = BullTrendColorG
HABarColorB = BullTrendColorB
ELSIF hadc THEN
HABarColorR = BearTrendColorR
HABarColorG = BearTrendColorG
HABarColorB = BearTrendColorB
ELSIF hadr THEN
HABarColorR = BearReversalColorR
HABarColorG = BearReversalColorG
HABarColorB = BearReversalColorB
ELSIF haur THEN
HABarColorR = BullReversalColorR
HABarColorG = BullReversalColorG
HABarColorB = BullReversalColorB
ELSIF hadu THEN
HABarColorR = BullTrendColorR
HABarColorG = BullTrendColorG
HABarColorB = BullTrendColorB
ELSE
HABarColorR = BearTrendColorR
HABarColorG = BearTrendColorG
HABarColorB = BearTrendColorB
ENDIF

haover = 0 // Overlays HA bars in place of regular candles.
rPrice = 0 // Displays 'real close' level

IF haover THEN
DRAWCANDLE(haOpen, haHigh, haLow, haClose) COLOURED(HABarColorR, HABarColorG, HABarColorB, 255)
ELSE
DRAWCANDLE(haOpen, haHigh, haLow, haClose) COLOURED(255, 255, 255, 255) // Default color (white) when haover is not active.
ENDIF

IF rPrice THEN
DRAWsegment(barindex - 1, close, barindex, close) COLOURED(HABarColorR, HABarColorG, HABarColorB, 255) // Displaying the real close level
ENDIF

c = (close > nT3Average[1] AND close[1] < nT3Average) OR (close < nT3Average[1] AND close[1] > nT3Average)
d = (nT3Average > anT3Average[1] AND nT3Average[1] < anT3Average) OR (nT3Average < anT3Average[1] AND nT3Average[1] > anT3Average)

// These conditions can be used in ProRealTime to create alerts.

RETURN nT3Average coloured(myColorR, myColorG, myColorB, 255), anT3Average coloured(T3ColorR, T3ColorG, T3ColorB, 255)