

Time periods indicator (calendar)
April 6, 2021, 9:09 AM
Indicators
0 Comments
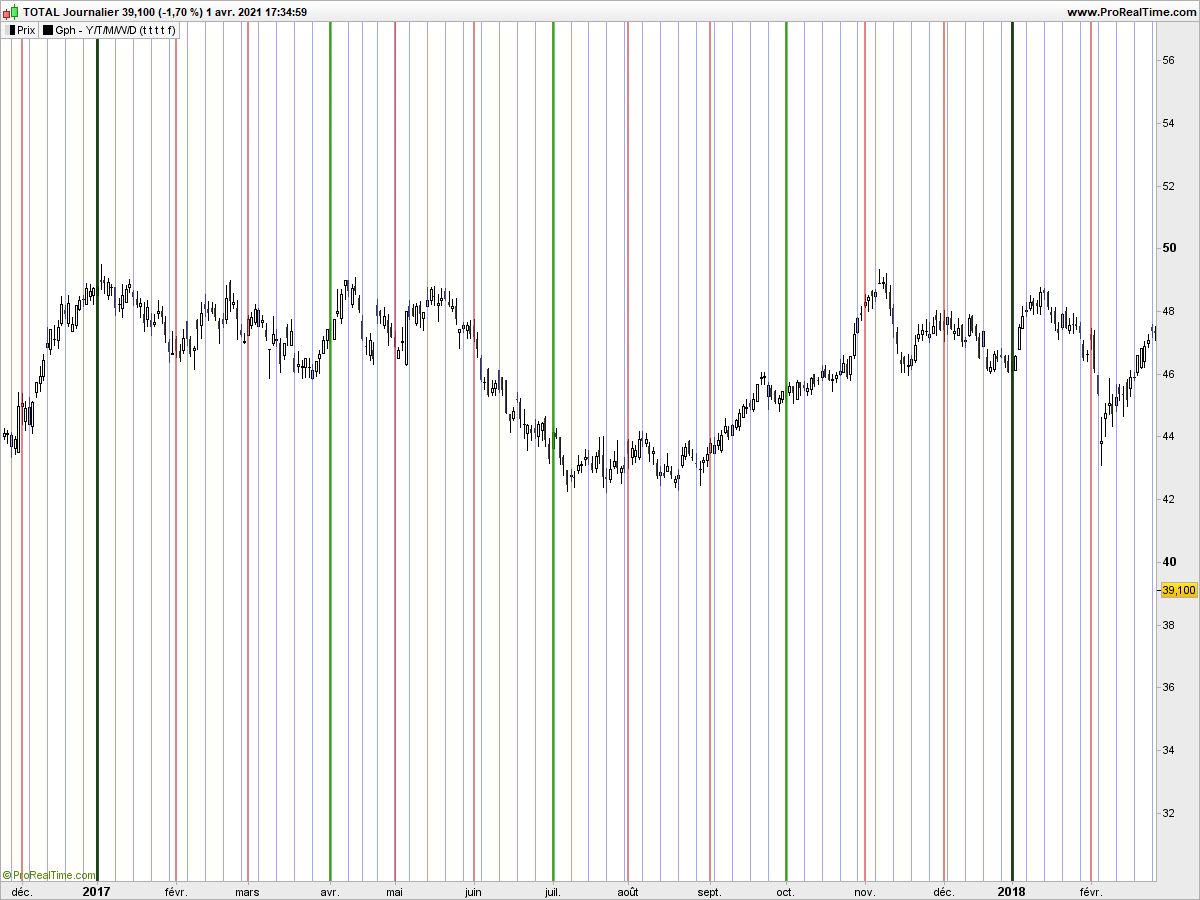
This period indicator helps to see different times periods on the price chart.
The ideal would be to have 1 year in the futur these different periods of time.
I failed to do anything conclusive.
Please download to have all the functionality
// --- settings
Jour = 1 //1 = display ; 0 = do not display (day)
Semaine = 1 //1 = display ; 0 = do not display (week)
Mois = 1 //1 = display ; 0 = do not display (month)
Trimestre = 1 //1 = display ; 0 = do not display (quarter)
Annee = 1 //1 = display ; 0 = do not display (year)
// --- end of settings

IF OpenDay[1]<>OpenDay THEN
d = barindex
IF Jour THEN
drawvline(d)coloured(200,150,0,150)style(line,1)
ENDIF
ENDIF

IF OpenDayOfWeek[1]>OpenDayOfWeek THEN
w = barindex
IF Semaine THEN
drawvline(w)coloured(100,100,255,150)style(line,1)
ENDIF
ENDIF

IF month[1] <> month THEN
m = barindex
IF Mois THEN
drawvline(m)coloured(200,50,50,150)style(line,2)
ENDIF
ENDIF

IF Month = 1 or Month = 4 or Month = 7 or Month = 10 THEN
IF month[1] <> month THEN
t = barindex
IF Trimestre THEN
drawvline(t)coloured(0,180,0,150)style(line,3)
ENDIF
ENDIF

ENDIF

IF OpenYear[1]<>OpenYear THEN
y = barindex
IF Annee THEN
drawvline(y)coloured(0,0,0,150)style(line,3)
ENDIF
ENDIF

RETURN
Download
Filename:
Time-periods-indicator.itf
Downloads:
76
Average
Operating in the shadows, I hack problems one by one. My bio is currently encrypted by a complex algorithm. Decryption underway...
Author’s Profile
Loading...