

Tension Flow Trend
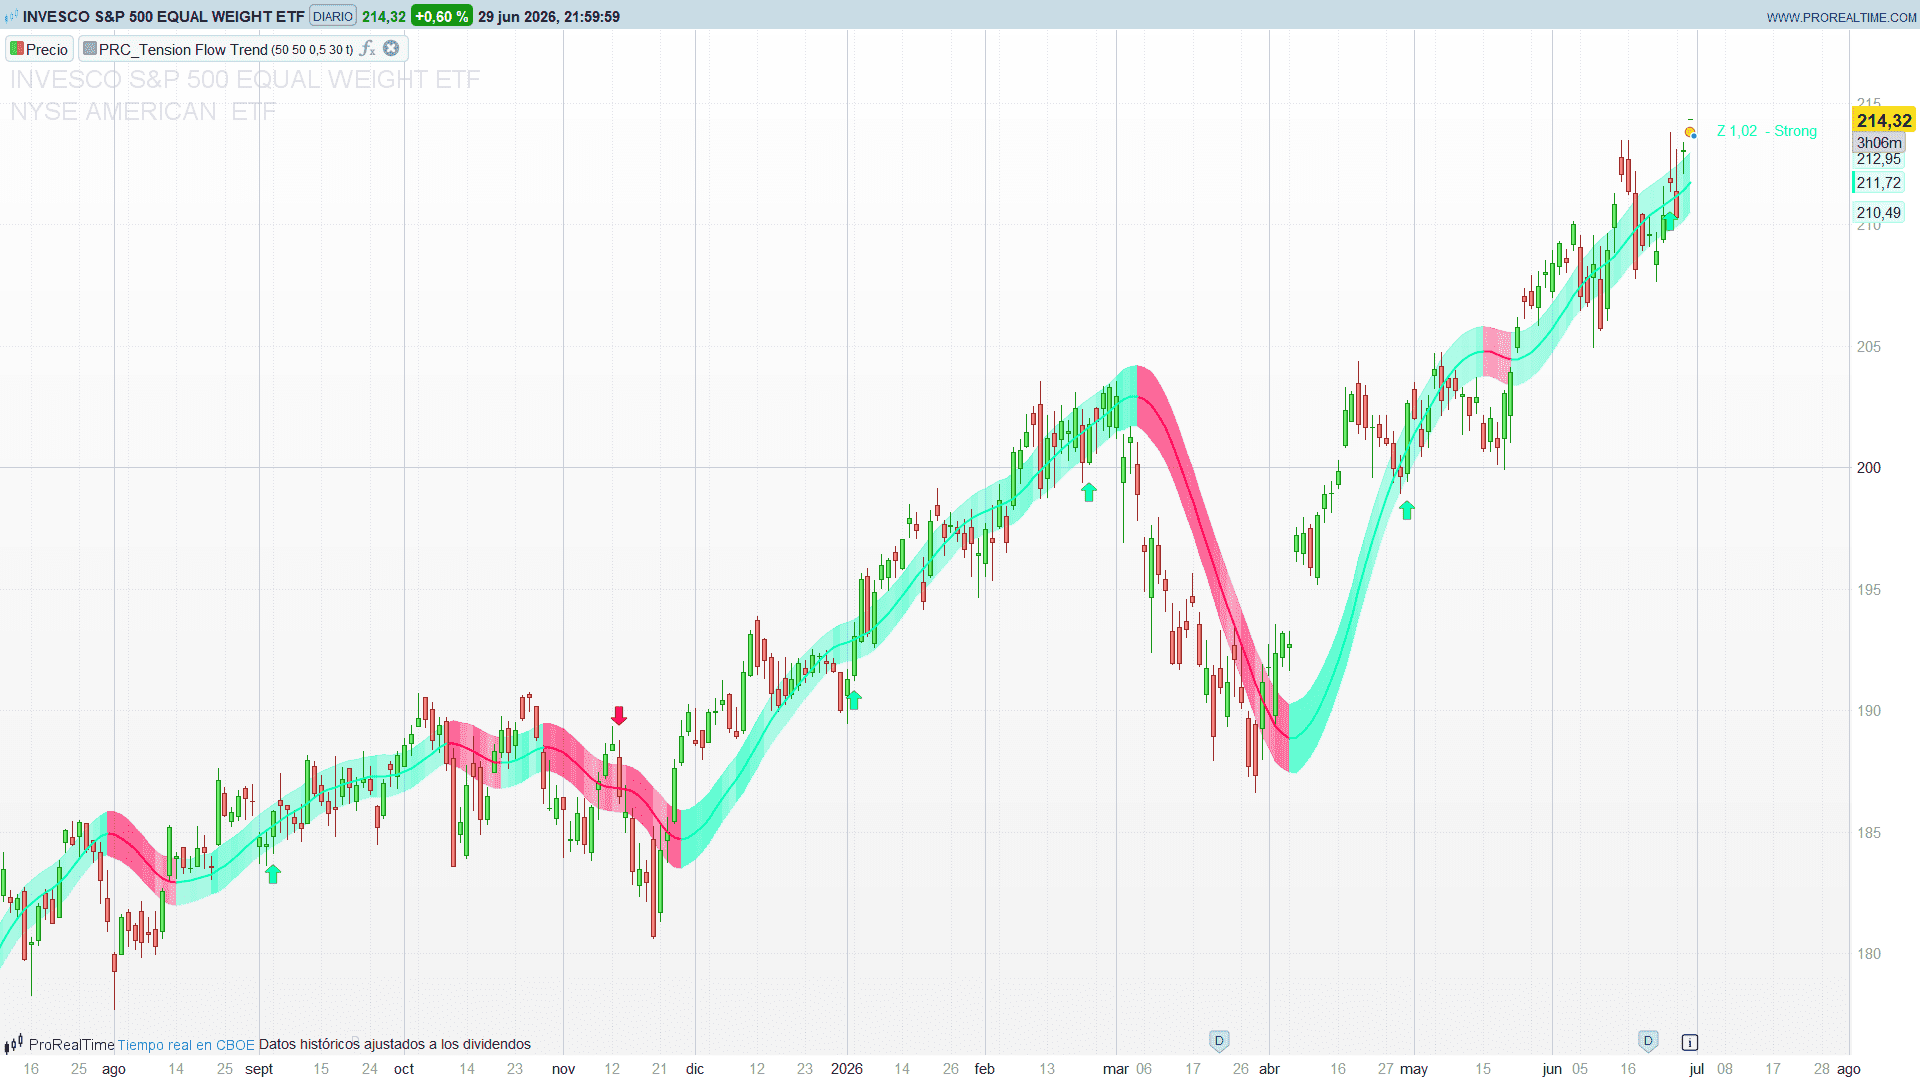
Most trend tools tell you which way the market is leaning. Far fewer tell you how stretched it is while it leans. Tension Flow Trend, by BigBeluga, does both from a single idea: take a fast Hull moving average as the trend baseline, then measure — in standard deviations — how far price has pulled away from that baseline. That distance, normalised into a Z-Score, is the “tension”. When tension is low the market is riding its trend calmly; when it spikes, price is over-extended and a snap back toward the baseline becomes more likely. The indicator paints this as a ribbon whose opacity grows with tension, colours everything by the slope of the baseline, and fires clean START (arrow) signals when price crosses the baseline in the direction the trend already points.
Theory Behind the Indicator
1. The Hull baseline
Everything hangs off a Hull Moving Average of the close (hmaLen = 50 by default). The Hull MA is chosen because it reacts fast with very little lag, so the “is the trend up or down?” question — answered simply by hmaValue > hmaValue[1] — flips promptly rather than dragging bars behind price. That single boolean, the slope, drives every colour in the indicator: bullish teal when the baseline is rising, bearish red when it is falling.
2. Tension as a Z-Score of the price deviation
Here is the core, and it is worth being precise about it. The indicator does not Z-score raw price (price trends, so a Z-Score of it is meaningless). It Z-scores the deviation of price from its own Hull baseline:
priceDist = close - hmaValue          // price detrended by the HMA
stdDev    = stdev(priceDist, zLen)     // its rolling standard deviation
zScore    = priceDist / stdDev         // tension, in standard deviations
Because priceDist is price with its trend removed, it oscillates around zero — exactly the kind of series a Z-Score is built for. The result reads in universal, instrument-independent units: |Z| ≈ 1 is an ordinary pull away from the baseline, |Z| > 2 is a stretch beyond two standard deviations (statistically uncommon — the indicator labels this regime Overextended). The same +2 means the same thing on a forex pair, an index or a stock, which is the whole point of normalising.
3. The tension ribbon
A band is drawn around the baseline, scaled by volatility:
upperRibbon = hmaValue + ATR(14) * offsetMult
lowerRibbon = hmaValue - ATR(14) * offsetMult
What makes it a tension ribbon rather than a plain envelope is the fill: its opacity scales with |Z|. When the market is calm and close to its baseline the ribbon is faint; as tension builds and price stretches away, the fill darkens. The colour is the slope colour. So at a glance you read two things at once — direction (colour) and stretch (opacity).
4. Slope-aligned signals with a cooldown
A START signal fires when price crosses the baseline in the direction the baseline already points:
bullSignal = hmaSlopeUp     AND close crosses over  hmaValue AND canTrigger
bearSignal = (not slopeUp)  AND close crosses under hmaValue AND canTrigger
The slope filter is what keeps the signals honest: a cross up through the baseline only counts as a long if the baseline itself is rising. To stop signals from clustering on choppy bars, a cooldown of signalGap bars (default 30) must elapse between them — tracked with a single bar-index counter rather than any heavy state:
canTrigger = barindex - lastSignalBar >= signalGap
How to Read the Indicator
- Colour is the trend. Teal baseline and ribbon = up-structure; red = down-structure. The colour flips with the slope of the Hull MA, not with price, so it is steadier than a raw price cross.
- Opacity is the stretch. A faint ribbon means price is hugging its baseline — a calm, low-tension trend. A dark, saturated ribbon means price is far from the baseline — high tension, elevated odds of a pullback toward it.
- START labels are slope-aligned entries (arrows). They only appear when price crosses the baseline with the trend, and never more often than once per signalGap bars.
- The energy reading is the regime. On the last bar the indicator prints the current Z-Score and a status: Strong while |Z| ≤ 2, Overextended (in amber) once |Z| > 2.
Practical Applications
- Trend filter with a stretch gauge. Use the slope colour as your directional bias and the ribbon opacity as a “do not chase” warning: take trend entries while tension is low, avoid piling in once the ribbon is saturated and the reading says Overextended.
- Mean-reversion timing inside a trend. A high |Z| against the baseline flags an over-extension; pullbacks from there toward the (faint again) baseline are the classic re-entry in the trend’s direction.
- Clean, de-clustered signals. The slope filter plus the cooldown make START a low-noise event — usable as the trigger of a discretionary entry or wired straight into a system.
- Cross-instrument thresholds. Because tension is a Z-Score, the same |Z| > 2 rule transfers across symbols and timeframes without re-tuning.
Indicator Configuration
- hmaLen (default 50): the Hull baseline length. Lower = faster, more signals and more colour flips; higher = smoother trend.
- zLen (default 50): the lookback for the tension Z-Score. Shorter = a more reactive, spikier tension reading; longer = steadier.
- offsetMult (default 0.5): ribbon half-width in ATR(14) multiples.
- signalGap (default 30): minimum bars between START signals.
- showLabels (default 1): set to 0 to hide the START labels and keep only the baseline, ribbon and energy reading.
The bullish/bearish colours are plain RGB constants at the top of the code (bull* / bear*); edit them to recolour the tool.
Code
//--------------------------------------------
// PRC_Tension Flow Trend (by BigBeluga)
// version = 0
// 22.06.2026
// Iván González @ www.prorealcode.com
// Sharing ProRealTime knowledge
//--------------------------------------------
// --- Inputs ---
hmaLen     = 50    // HMA Length (trend baseline)
zLen       = 50    // Z-Score Length (tension lookback)
offsetMult = 0.5   // Ribbon Width (ATR multiplier)
signalGap  = 30    // Signal Cooldown (bars between signals)
showLabels = 1     // Show START labels (1 = yes, 0 = no)
// --- Colors (R, G, B) ---
bullR = 0
bullG = 255
bullB = 187
bearR = 255
bearG = 0
bearB = 85
//--------------------------------------------
// --- Trend baseline: Hull Moving Average ---
hmaValue   = HullAverage[hmaLen](close)
hmaSlopeUp = hmaValue > hmaValue[1]
//--------------------------------------------
// --- Z-Score of the price deviation (tension) ---
// priceDist is price detrended by its own HMA -> safe to Z-score
priceDist = close - hmaValue
stdDev    = std[zLen](priceDist)
IF stdDev = 0 THEN
   stdDev = 0.0001
ENDIF
zScore = priceDist / stdDev
absZ   = abs(zScore)
//--------------------------------------------
// --- ATR ribbon around the baseline ---
atr14       = averagetruerange[14](close)
upperRibbon = hmaValue + atr14 * offsetMult
lowerRibbon = hmaValue - atr14 * offsetMult
//--------------------------------------------
// --- Trend color by slope ---
IF hmaSlopeUp THEN
   rC = bullR
   gC = bullG
   bC = bullB
ELSE
   rC = bearR
   gC = bearG
   bC = bearB
ENDIF
//--------------------------------------------
// --- Ribbon fill: opacity grows with tension |Z| ---
// adapted from the Pine gradient, capped so price stays visible
dynTransp  = min(90, max(10, absZ * 25))
fillTransp = max(0, 80 - dynTransp)
fillAlpha  = min(150, round(255 * (1 - fillTransp / 100)))
colorbetween(hmaValue,    upperRibbon, rC, gC, bC, fillAlpha)
colorbetween(lowerRibbon, hmaValue,    rC, gC, bC, fillAlpha)
//--------------------------------------------
// --- Signals: slope-aligned cross of price vs baseline, with cooldown ---
once lastSignalBar = -100
canTrigger = barindex - lastSignalBar >= signalGap
crossUp = close crosses over hmaValue
crossDn = close crosses under hmaValue
bullSignal = hmaSlopeUp and crossUp and canTrigger
bearSignal = (not hmaSlopeUp) and crossDn and canTrigger
IF bullSignal OR bearSignal THEN
   lastSignalBar = barindex
ENDIF
//--------------------------------------------
// --- START labels ---
IF showLabels = 1 AND bullSignal THEN
   //   drawtext("START", barindex, low - atr14 * 0.5) coloured(bullR, bullG, bullB)
   drawarrowup(barindex, low - atr14 * 0.5) coloured(bullR, bullG, bullB)
ENDIF
IF showLabels = 1 AND bearSignal THEN
   //   drawtext("START", barindex, high + atr14 * 0.5) coloured(bearR, bearG, bearB)
   drawarrowdown(barindex, high + atr14 * 0.5) coloured(bearR, bearG, bearB)
ENDIF
//--------------------------------------------
// --- Energy reading on the last bar: Z-Score + status ---
zRound = round(zScore * 100) / 100
IF absZ > 2.0 THEN
   statR = 255
   statG = 165
   statB = 0
ELSE
   statR = rC
   statG = gC
   statB = bC
ENDIF
IF islastbarupdate THEN
   IF absZ > 2.0 THEN
      drawtext("Z #zRound# - Overextended", -150, -100) coloured(statR, statG, statB)anchor(topright,xshift,yshift)
   ELSE
      drawtext("Z #zRound# - Strong", -150, -100) coloured(statR, statG, statB)anchor(topright,xshift,yshift)
   ENDIF
ENDIF
//--------------------------------------------
RETURN hmaValue AS "Trend Baseline" coloured(rC, gC, bC) style(line, 2), upperRibbon AS "Upper Ribbon" coloured(rC, gC, bC, 50) style(line, 1), lowerRibbon AS "Lower Ribbon" coloured(rC, gC, bC, 50) style(line, 1)
