

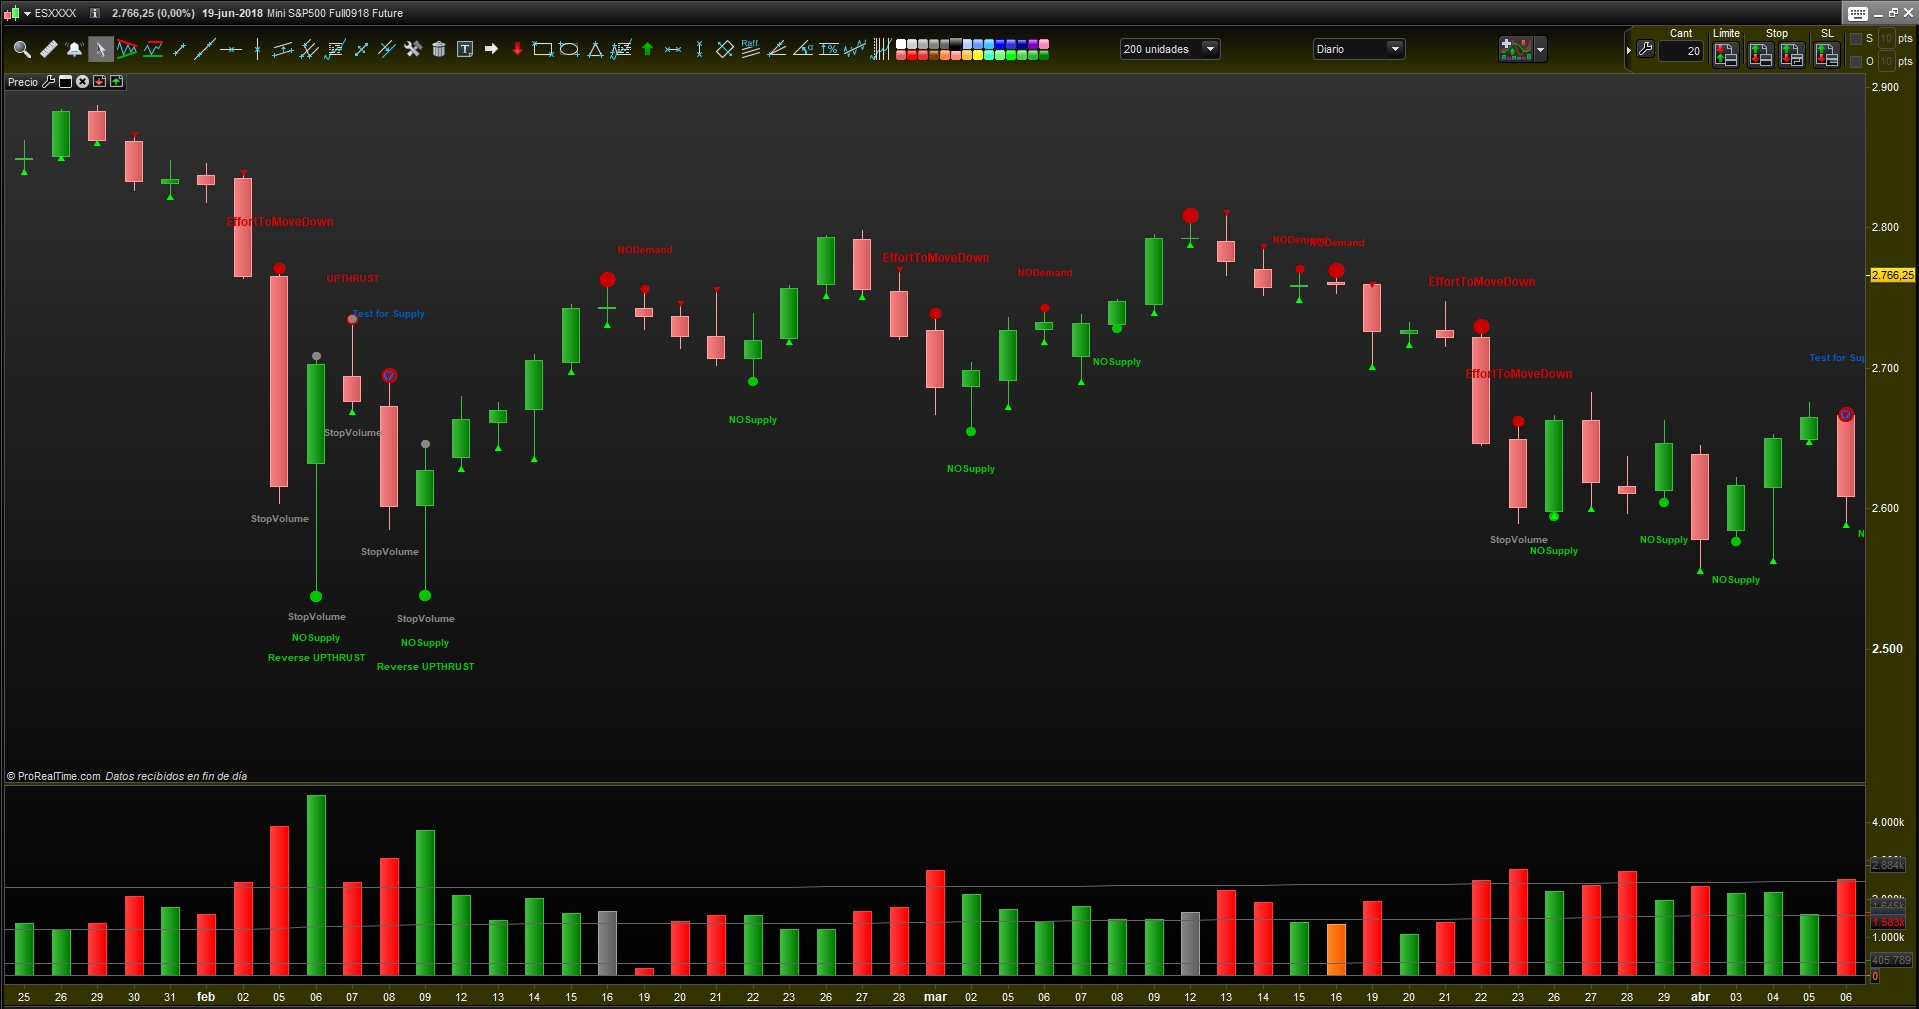
TAC VSA Volume Spread Analysis
Following the principles of Holey, Wyckoff, Livermore, Tom Williams, and Anna Coulling among others.
We have related the main ones:
▴Candle / Bullish Bar //green triangle
▾ Candle / Bearish Bar //red triangle
- Sign indicating an anomaly between price and volume where a turn can be made in any direction by indecision. //circle
- NODemand //red circle
-In this situation professionals will not sustain the market if they observe weakness in the background.
-If the volume is low in bullish days, this shows no demand for the big ones.
-NO DEMAND BAR: narrow range bar, low volume, close in half or in the lower part..
- NOSupply //green circle
At the end of a bearish trend or bullish turn within the bearish trend, we will see an increase in hammer or candle candles with large shadows below that indicate demand pressure.
- Test for Supply / Test Volume //blue circle
Bearish bars: If the price falls with volume lower than the two previous bars, with narrow range, and the current candle that marks the price closes in half or higher, indicates “NOSupply”.
- StopVolume //gray circle
It shows the moment when purchases cover all sales.
-A high volume, bearish bar, wide range, will normally indicate sales, but …
-If the next day is bullish and close at maximum, this shows that the purchases absorbed the sales the previous day.
– Only professional money can do this and it is a good indicator of strength.
EFFORT:
- UP //green circle
- DOW //red circle
- UPTHRUST //red circle
- REVERSE UPTHRUST //green circle
////////////////////////////////////////////////////////////////////////

REM VSA Volume
REM TAC VSA | indicator
REM 09.06.2018
REM RB @ www.tiburonesdealetacorta.com
REM Sharing www.tiburonesdealetacorta.com

vol=volume
atr = averagetruerange[10](close)*0.5
mm= average[100](volume)
VolumeMA = Average[50](mm)
Vlow = (VolumeMA - ((VolumeMA * 75) / 100))
VolumeMAA = Average[85](mm)
Vhigh = (VolumeMAA + ((VolumeMAA * 85) / 100))

SPREADHL = (High[0]-Low[0])/2
AvgSpread= Average[50](SPREADHL)
SPREAD1 = High -low/2
Spread2= Abs(High[0]-Low[0])
WIDE= (SPREAD1[0] > Spread2[1]*1.8)
NARROWS= SPREADHL[0] < AvgSpread[1]*0.8

MIDCLOSE = (open+close)/2
UPBAR =(close[0] >= open[0]) // barra alcista
DOWNBAR =(close[0] <= open[0]) // barra bajista
DOWNCLOSE=(Close[1]<=(((High[0]-Low[0])*0.3)+Low[1]))
UPCLOSE = (Close[1]>=(High[0]-((High[0]-Low[1])*0.3)))
UP=max(UPCLOSE, UPBAR)
Down= min(DOWNBAR, DOWNCLOSE)

//Move Price
if UP then
 DrawText("▴",barindex,low,SansSerif,bold,15)coloured(0,255,0)
endif

if Down then
 DrawText("▾",barindex,high,SansSerif,bold,15)coloured(200,0,0)
endif

//Divergence ---- anomaly Price & Volume
ND1=(abs(open - close) <= (high - low) * 5/100) and vol > mm and up
ND2=open[1] < close and vol < vol[1] and close[1]< close and DOWNBAR
ND3=WIDE and vol > vhigh[1] and DOWNclose and Close[2]>Close[3] and High[1]>High[2]
ND= ND1 or ND2 or ND3

if ND then
 DrawText("●",barindex,High,SansSerif,bold,20)coloured(200,0,0)
endif

//NoDemand
ND1= Vol[1] < vol[2] and UPCLOSE and DOWNBAR and (abs(open - close) <= (high - low)/2 )
ND2 = volume < Vlow and Vol[0]<Vol[1]
ND3 =(open[1] > close[1] and close > open and close <= open[1] and close[1] <= open and close - open < open[1] - close[1] ) and (abs(open - close) <= (high - low) * 5/100) and Vol[1]<Vol[2]
ND4=(Close[1] > Close[2] and Close[1] < MIDCLOSE and narrows and Vol[1] < vol[2] and Vol[2] < vol[3])

NoDemand = ND1 or ND2 or ND3 or ND4
if NoDemand then
 DrawText("NODemand",barindex,high+atr*1,SansSerif,bold,10)coloured(200,0,0)
 DrawText("●",barindex,high,SansSerif,bold,10)coloured(200,0,0)
endif

//Stopping Volume
STPV1= Vol[0] > Vhigh[1] and Vol[1] > Vhigh[2]

StoppingVolume = STPV1
if StoppingVolume then
 DrawText("StopVolume",barindex,low-atr*0.5,SansSerif,bold,10)coloured(135,135,135)
 DrawText("●",barindex,high,SansSerif,bold,10)coloured(135,135,135)
endif

NSP1= (Close[1] < Close[2] and Close[1] < MIDCLOSE and wide and Vol[1] > Vhigh[2])
NSP2=(Close[1] < Close[2] and Close[1] < MIDCLOSE and wide and Volume[1]>Volume[2])

//NO Supply
NOSupply = NSP1 or NSP2
if NOSupply then
 DrawText("NOSupply",barindex,low-atr*1,SansSerif,bold,10)coloured(0,200,0)
 DrawText("●",barindex,low,SansSerif,bold,12)coloured(0,200,0)
endif

TESNSP1=(Close[1] < Close[2] and Close[1] > UP and Vol[1] < Vol[2] and Vol[0] < vlow[1])
TESNSP2 = wide and DOWN and Vol > Vhigh[1] and vol[2] > vol[3] and Close[2]>Close[3] and High[1]>High[2]
TESNSP3= wide and UP and Vol > Vhigh[1] and vol[2] > vol[3] and Close[2]<Close[3] and low[1]<low[2]

//Test for Supply
TESNSP = TESNSP1 or TESNSP2 or TESNSP3 and UPTHRUST
if TESNSP then
 DrawText("Test for Supply",barindex,high+atr*1.4,SansSerif,bold,10)coloured(0,90,190)
 DrawText("●",barindex,high,SansSerif,bold,12)coloured(0,90,190)
endif

//"Reverse UPTHRUST"
RUT1= (Close[1] < Close[2] and Close[1] < MIDCLOSE and wide and vol > vhigh[1] and vol[1] > vhigh[2] )

ReverseUPTHRUST = RUT1
if ReverseUPTHRUST then
 DrawText("Reverse UPTHRUST",barindex,low-atr*1.5,SansSerif,bold,10)coloured(0,200,0)
 DrawText("●",barindex,low,SansSerif,bold,15)coloured(0,200,0)
endif

//UPTHRUST
UT1 =(Close[1] > Close[2] and Close[1] > MIDCLOSE and Low[1] < Low[2] and Low[2] < Low[3] and wide and Vol[1] > vol[2])

UPTHRUST= UT1
if UPTHRUST then
 DrawText("UPTHRUST",barindex,high+atr*1,SansSerif,bold,10)coloured(200,0,0)
 DrawText("●",barindex,high,SansSerif,bold,15)coloured(200,0,0)
endif

//Effort To Move Down
EFTD1=WIDE and DOWNBAR and DOWNCLOSE and vol > vhigh and Vol[1]>Vol[2]
EffortToMoveDown =EFTD1

if EffortToMoveDown then
 DrawText("EffortToMoveDown",barindex,high+atr*1.5,SansSerif,bold,12)coloured(200,0,0)
 DrawText("●",barindex,high,SansSerif,bold,15)coloured(200,0,0)
endif

//Effort To Move Up
EFTU1=WIDE and UPBAR and UPclose and vol > vhigh and Vol[1]>Vol[2]

EffortToMoveup = EFTU1
if EffortToMoveup then
 DrawText("EffortToMoveup",barindex,low-atr*1.5,SansSerif,bold,10)coloured(0,200,0)
 DrawText("●",barindex,low,SansSerif,bold,15)coloured(0,200,0)
endif

Return