

TAC Volume Cumulative
April 5, 2019, 1:12 PM
Indicators
5 Comments
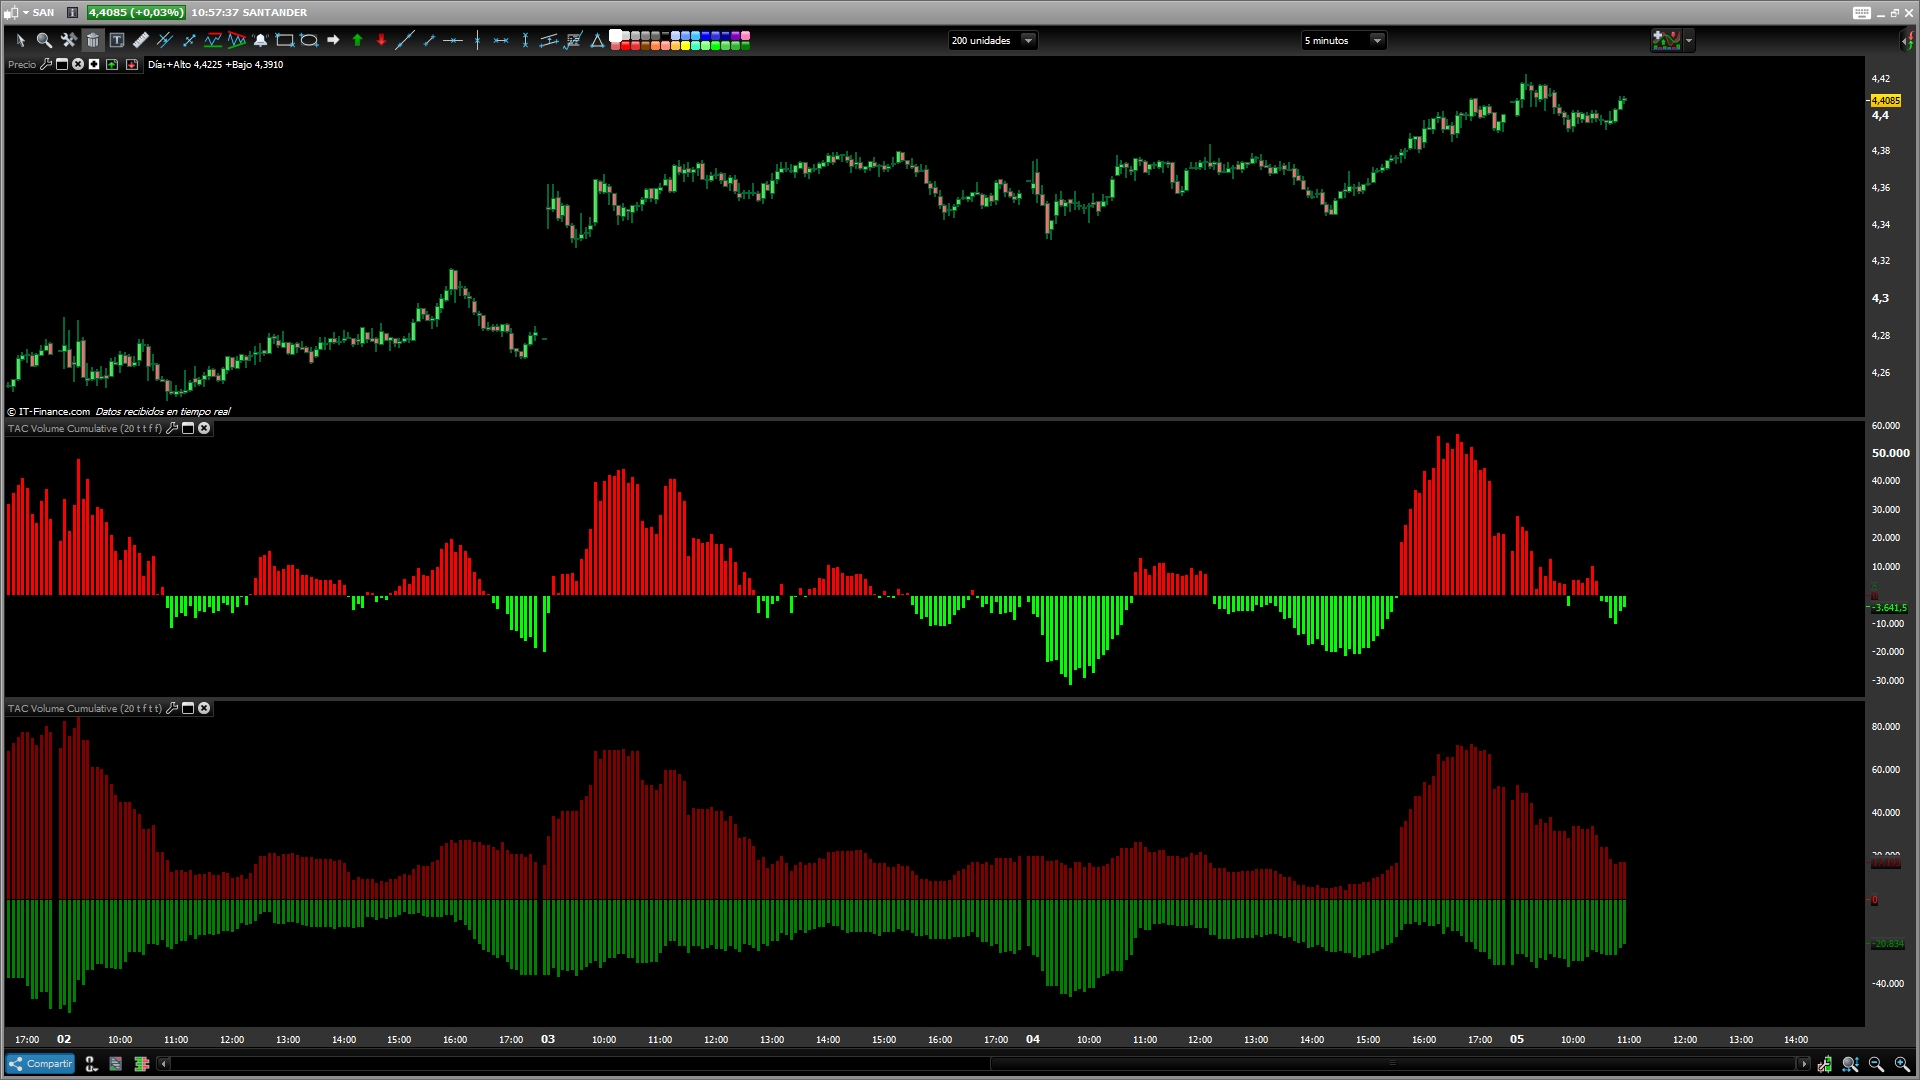
Will show the total volume for the selected period.
can choose between.
– Relative and Absolute presentation.
– Cumulative or Separated (Up/Down) data presentation.
-Invert color in Combined Presentation
-Hide subasta
///////////////////////////////////////////////////////////////////////
REM TAC Volume Cumulative
REM TAC Volume Cumulative | indicator
REM 03.07.2014
REM TAC @ www.tiburonesdealetacorta.com
REM Sharing www.tiburonesdealetacorta.com
////////////////////////////////////////////////////////////////////////

If subasta=1 then
 b=close > low and volume > high
 ce=close < high and volume > low
 if b or ce then
  vols=volume
 else
  vols=0
 endif
endif
if subasta=0 then
 vols=volume
endif

if (Close[0]>Close[1]) then
 VolA=Vols[0]/100
 VolB=0
else
 VolB=Vols[0]/100
 VolA=0
endif

p=summation[length](VolA)
n=summation[length](VolB)

If Combined=1 then
 Cumulative=p-n
endif

if Relative=1 then
 Positive=p
 Negative=-n
endif

If invert=1 then
 If cumulative>0 then
  r=0
  g=255
  b=0
 else
  r=255
  g=0
  b=0
 endif
endif

If invert=0 then
 If cumulative<0 then
  r=0
  g=255
  b=0
 else
  r=255
  g=0
  b=0
 endif
endif
return cumulative coloured (R,g,B) style(histogram) as "Volume Cumulative", positive coloured (128,0,0) style(histogram) as "Positive" ,negative coloured (0,128,0) style(histogram) as "Negative"
Download
Filename:
TAC-Volume-Cumulative.itf
Downloads:
330
Master
Analista independiente y programador de indicadores.
Author’s Profile
Loading...