

TAC Trader Zone
June 7, 2018, 7:17 AM
Indicators
23 Comments
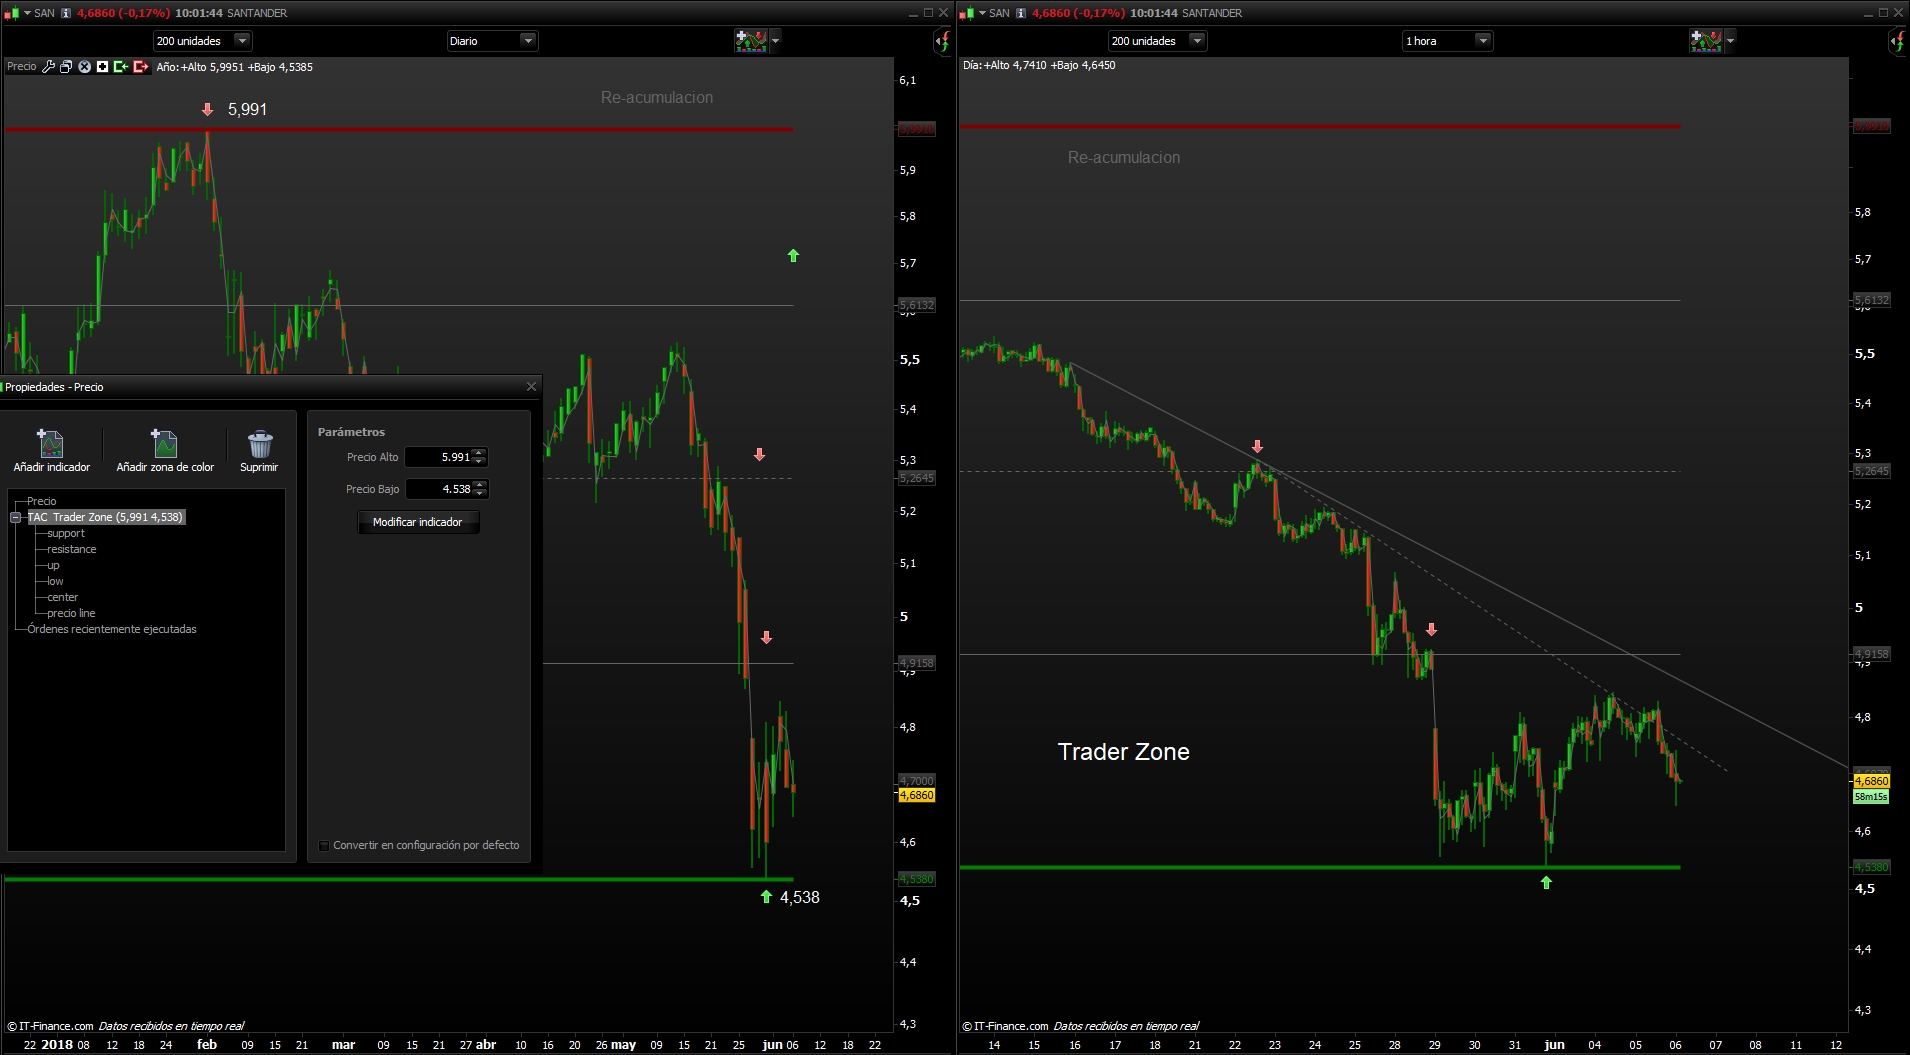
Supports and resistances based on the proportion of the wave.
They are drawn from the daily chart maximum and minimum to obtain the proportionality of the market.
The result is a Trader zone in lower graphics.
//////////////////////////////////////////////////////////
//TAC Trader Zone | indicator
//06.06.2018
//RB @ www.tiburonesdealetacorta.com
//Sharing ProRealTime
/////////////////////////////////////////////////////////////
//pa = 5,991
//pb = 4,538
HI=high-close
lo=low+open
mm = (hi + lo) / 2
mem = (pa + pb) /2
delta = pa - pb
cla = delta * 0.26
cla1 = delta * 1
cla2 = delta * 1

a = pa - cla
b = pb + cla
c = pa - cla1
d = pb + cla2

return c coloured (0,128,0) as "support", d coloured (128,0,0) as "resistance", a coloured (102,102,102) as "up", b coloured (102,102,102) as "low",mem coloured (102,102,102) as "center",mm coloured (102,102,102) as "precio line"
Download
Filename:
TAC-Trader-Zone.itf
Downloads:
418
Master
Analista independiente y programador de indicadores.
Author’s Profile
Loading...