Swinglines
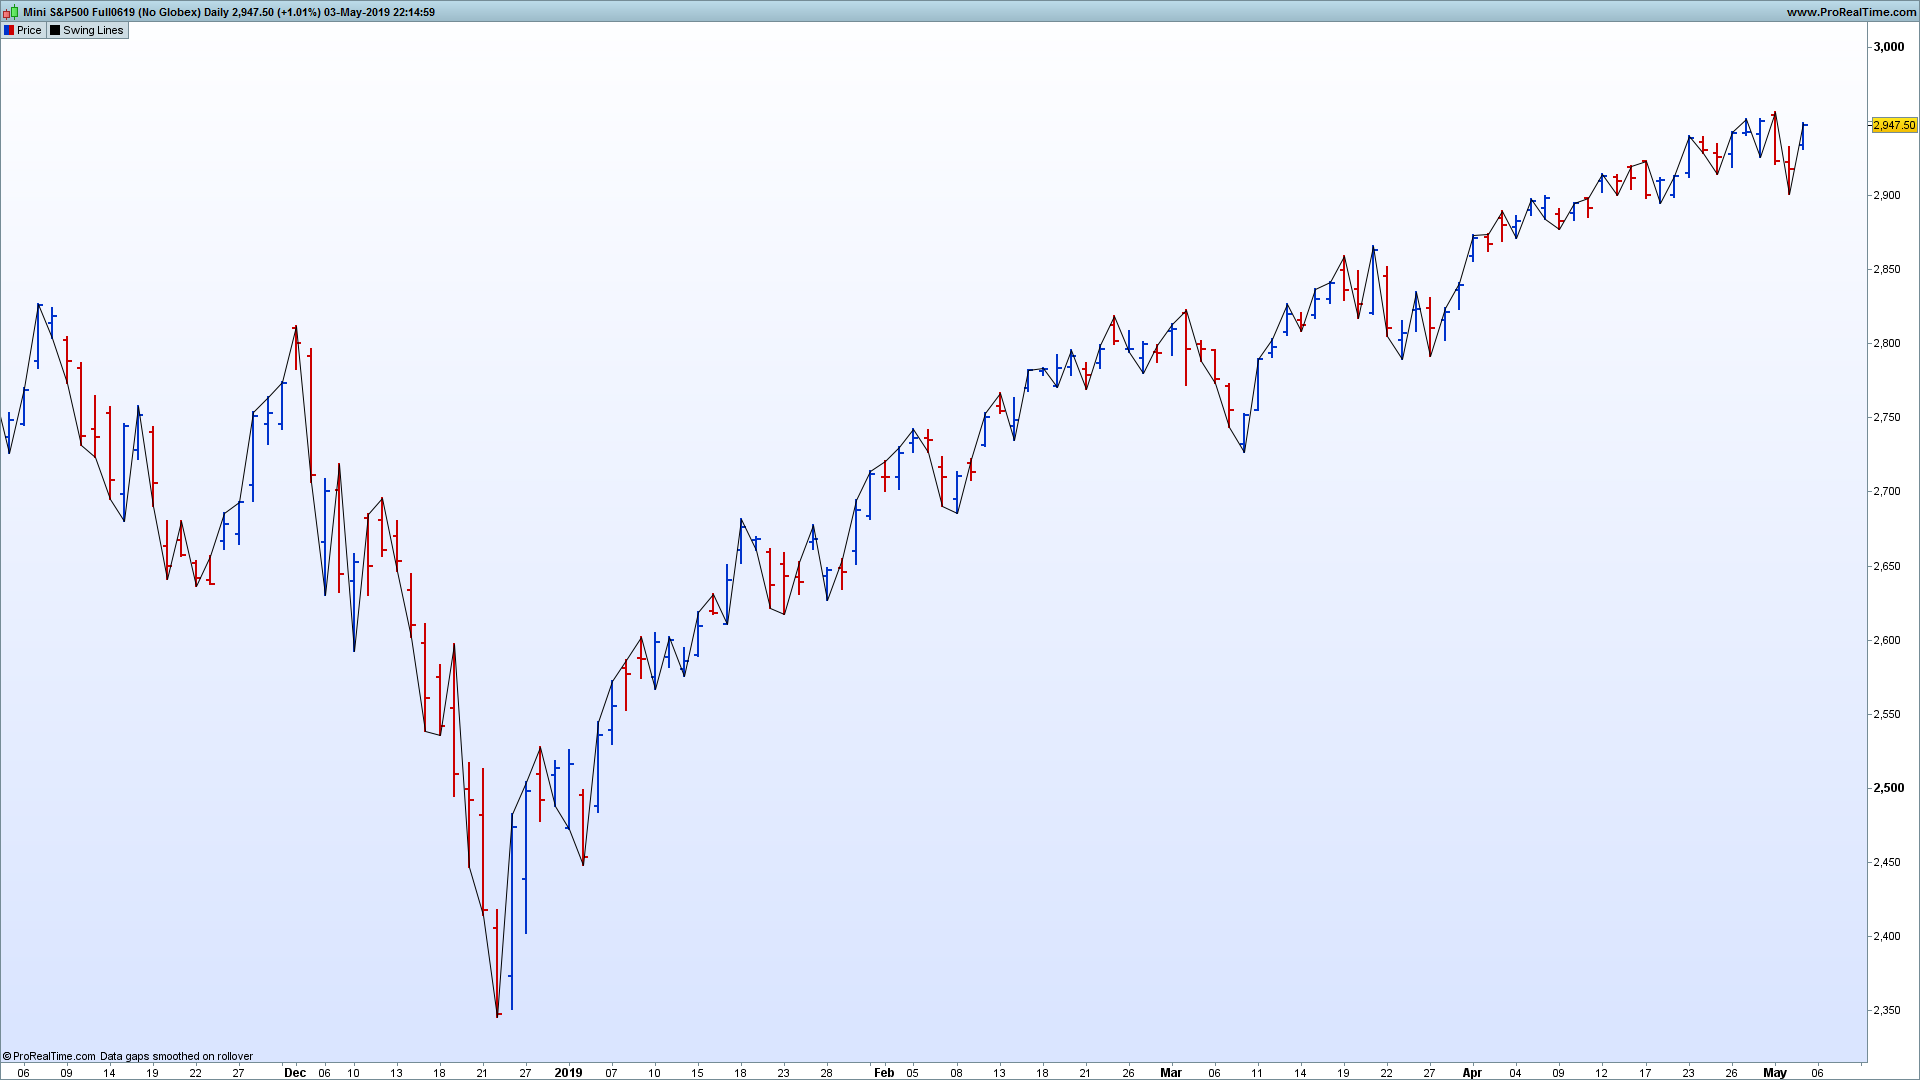
“Swinglines” is an indicator devised by Ira Epstein, that you can see in his YouTube videos (his YT channel https://www.youtube.com/user/IraEpsteinFutures )
He uses this indicator to show the trend, with respect to
- higher highs
- lower lows
- inside days
- outside days up
- outside days down
It connects higher highs, lower lows, in case of an Inside day the swingline reverts, in case of Outside days the swingline goes to the part of the bar where Open is.
My only doubt is the case of an Outside “doji” day, that I made equal to an Inside day (the swingline reverts)
Since the indicator is copyrighted I only tried to replicate it by looking at his videos, looking at his charts and listening to his (interesting) comments.
It seems to replicate it 100%
The original Forum thread is here https://www.prorealcode.com/topic/help-with-drawsegment/
//Swing Lines (from an idea by Ira Epstein)

HH=high[0]>high[1] AND low[0]>=low[1]
LL=high[0]<=high[1] AND low[0]<low[1]
ID=high[0]<=high[1] AND low[0]>=low[1]
ODU=high[0]>high[1] AND low[0]<low[1] AND close[0]>open[0]
ODD=high[0]>high[1] AND low[0]<low[1] AND close[0]<open[0]
DOJI=high[0]>high[1] AND low[0]<low[1] AND close[0]=open[0]

//higher highs higher lows
if HH then
 DRAWSEGMENT(x1,y1,barindex[0],high[0])coloured(0,0,0)
 x1=barindex[0]
 y1=high[0]
 flag=1

//lower highs lower lows
elsif LL then
 DRAWSEGMENT(x1,y1,barindex[0],low[0])coloured(0,0,0)
 x1=barindex[0]
 y1=low[0]
 flag=0

//inside day
elsif ID then
 //if after uptrend
 if flag=1 OR flag=3 OR flag=5 OR flag=7 then
  DRAWSEGMENT(x1,y1,barindex[0],low[0])coloured(0,0,0)
  x1=barindex[0]
  y1=low[0]
  flag=4
  //if after downtrend
 elsif flag=0 OR flag=2 OR flag=4 OR flag=6 then
  DRAWSEGMENT(x1,y1,barindex[0],high[0])coloured(0,0,0)
  x1=barindex[0]
  y1=high[0]
  flag=5
 endif

//outside day up
elsif ODU then
 DRAWSEGMENT(x1,y1,barindex[0],low[0])coloured(0,0,0)
 x1=barindex[0]
 y1=low[0]
 flag=2

 //outside day down
elsif ODD then
 DRAWSEGMENT(x1,y1,barindex[0],high[0])coloured(0,0,0)
 x1=barindex[0]
 y1=high[0]
 flag=3

//outside day doji
elsif DOJI then
 //if after uptrend
 if flag=1 OR flag=3 OR flag=5 OR flag=7 then
  DRAWSEGMENT(x1,y1,barindex[0],low[0])coloured(0,0,0)
  x1=barindex[0]
  y1=low[0]
  flag=6
 //if after downtrend
 elsif flag=0 OR flag=2 or flag=4 OR flag=6 then
  DRAWSEGMENT(x1,y1,barindex[0],high[0])coloured(0,0,0)
  x1=barindex[0]
  y1=high[0]
  flag=7
 endif

endif

Return