

Supply & Demand - Order Blocks
September 14, 2022, 9:31 AM
Indicators
54 Comments
Hello PRC/PRT Community,
Below is a joint work between Nicolas (90%) and myself (10%) to convert Order Blocks code from TradingView. All credits go to Sonarlabs who made it available to the public.
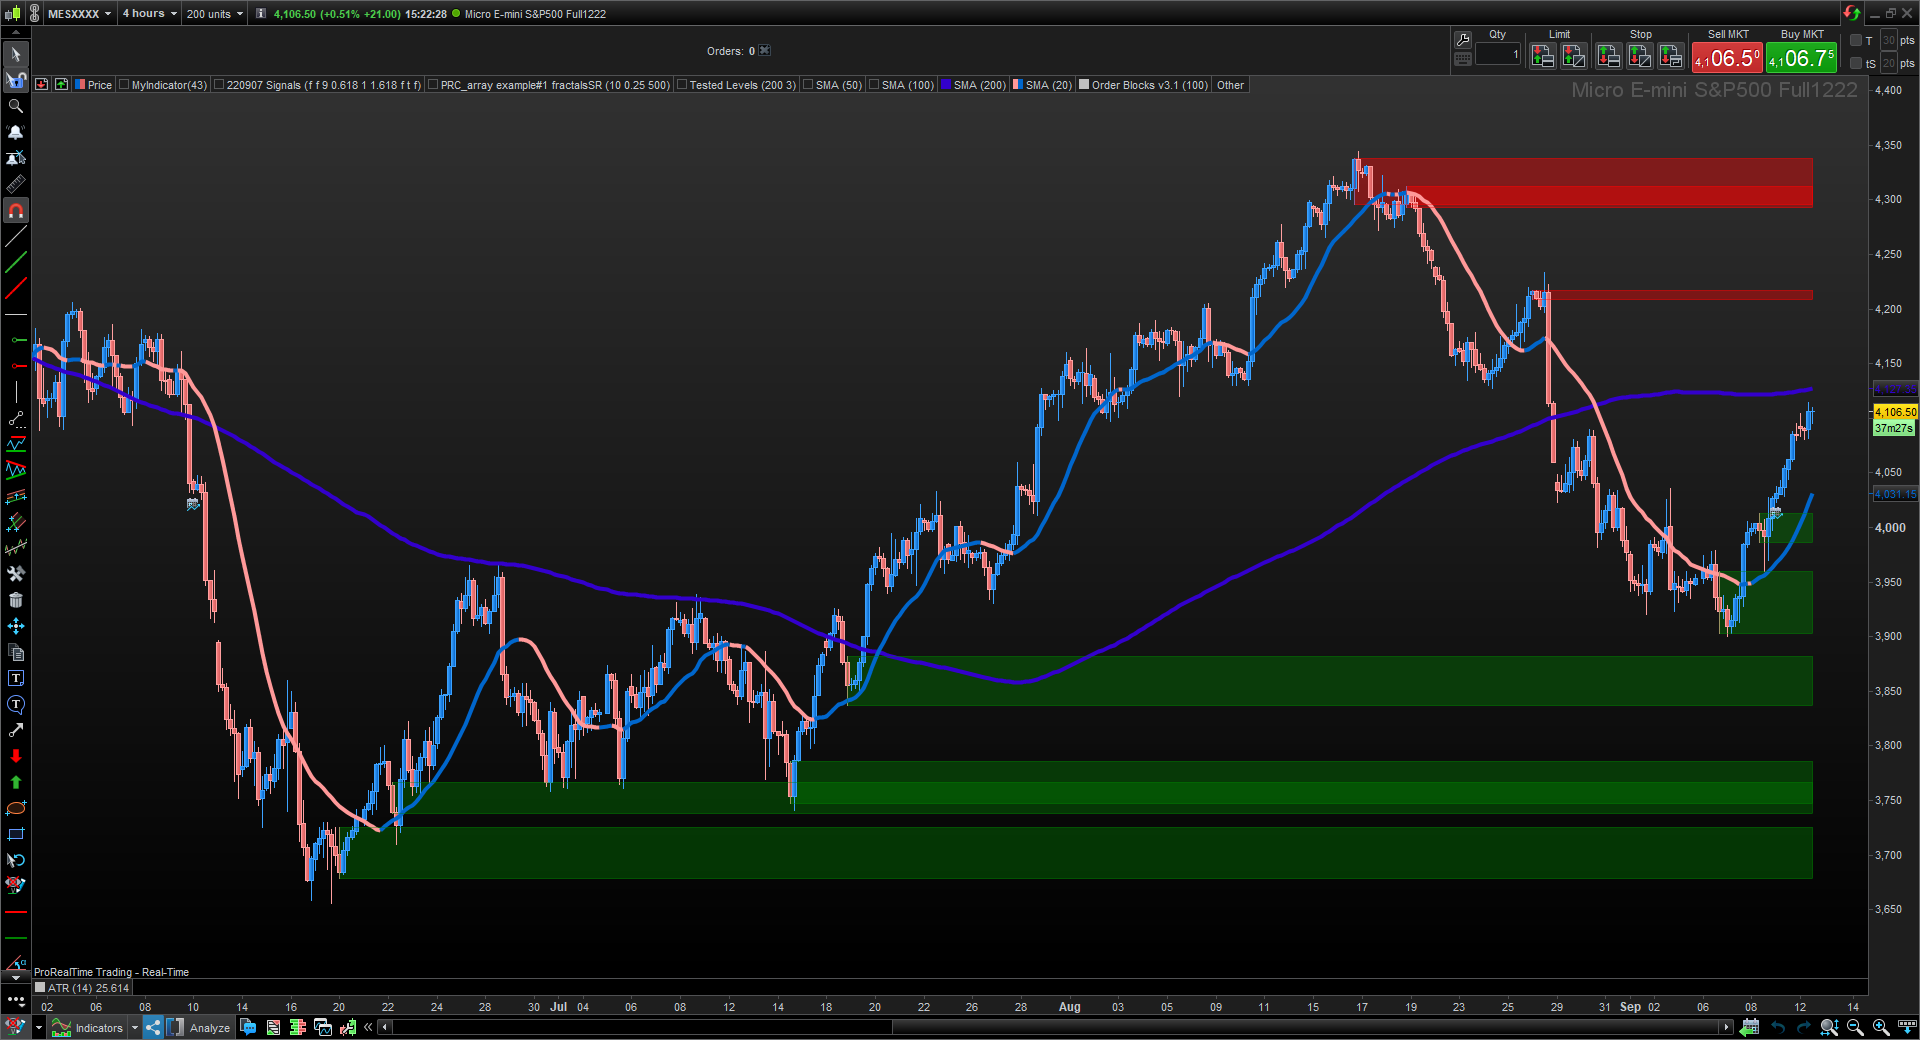
For those who trade with Supply and Demand zones, this indicator could help you identify the zones where most likely there are unfilled orders left, which can be a magnet or Support and Resistance. It does not give signals, but it’s definitely a good complement with your Price Action tools. You need to pay attention how the price reacts to these zones, then take action and apply your own system.
You can change the “Sens” parameter to adjust to your Asset and Timeframe.
Above picture shows ES Futures on H4.
// Sonarlabs - Order Block Finder
// converted from TradingView
// Lower the sensitivity to show more order blocks. A higher sensitivity will show less order blocks

defparam drawonlastbaronly=true

Transparency = 80

sens = 28

once obcreatedbear = 0
once obcreatedbull = 0
once crossindexbear = 0
once crossindexbull = 0


// Custom Rate of Change (ROC) calculation. This is to calculate high momentum moves in the market.
pc = ((open - open[4]) / open[4]) * 100


// -----------------
sens = sens/100 //ExponentialAverage[8](pc) //sens/100
OBBullMitigation = close[1]
OBBearMitigation = close[1]


// If the ROC crossover our Sensitivty input - Then create a Bearish Order Block
// Sensitivty is negative as this is a Bearish OB
if pc crosses under -sens then
obcreatedbear = 1
crossindexbear = barindex
endif


// If the ROC crossover our Sensitivty input - Then create a Bullish Order Block
if pc crosses over sens then
obcreatedbull = 1
crossindexbull = barindex
endif


////////////////////////////////////////////////////////////////////////////////////////////////////////////////
//      Calculation
////////////////////////////////////////////////////////////////////////////////////////////////////////////////

// -------------------------------
// Bearish OB Creation
// -------------------------------
// Check if we should create a OB. Also check if we haven't created an OB in the last 5 candles.
if obcreatedbear and (crossindexbear - crossindexbear[1]) > 5 then
lastgreen = 0
hhighest = 0
// Loop through the most recent candles and find the first GREEN (Bullish) candle. We will place our OB here.
for i = 4 to 15
if close[i] > open[i] then
lastgreen = i
//populate the arrays of order block to draw them later
$left[plot]= barindex[lastgreen]
$top[plot]=high[lastgreen]
$bottom[plot]=low[lastgreen]
$right[plot]=barindex[lastgreen]
plot=plot+1 //increase the array column for next data
break
endif
next
endif


// -------------------------------
// Bullish OB Creation
// -------------------------------
// Check if we should create a OB, Also check if we haven't created an OB in the last 5 candles.
if obcreatedbull and (crossindexbull - crossindexbull[1]) > 5 then
lastred = 0
hhighest = 0
// Loop through the most recent candles and find the first RED (Beaarish) candle. We will place our OB here.
for ibull = 4 to 15
if close[ibull] < open[ibull] then
lastred = ibull
//populate the arrays of order block to draw them later
$leftbull[plotbull]= barindex[lastred]
$topbull[plotbull]=high[lastred]
$bottombull[plotbull]=low[lastred]
$rightbull[plotbull]=barindex[lastred]
plotbull=plotbull+1 //increase the array column for next data
break
endif
next
endif


////////////////////////////////////////////////////////////////////////////////////////////////////////////////
//      Cleanup
////////////////////////////////////////////////////////////////////////////////////////////////////////////////

// Clean up Bearish OB boxes
if plot>0 then
for j = plot-1 downto 0 //0 to plot-1
// If the two last closes are above the high of the bearish OB - Remove the OB
if $left[j]>0 then //check if the zone still exist
itop = $top[j]
breakout = summation[max(1,barindex-$left[j])](OBBearMitigation>itop)>=1 //2
if breakout then
$left[j]=0
endif
endif
next
endif

// Clean up Bullish OB boxes
if plotbull>0 then
for jbull = plotbull-1 downto 0 //0 to plotbull-1
// If the two last closes are below the low of the bullish OB - Remove the OB
if $leftbull[jbull]>0 then //check if the zone still exist
ibot = $bottombull[jbull]
breakoutbull = summation[max(1,barindex-$leftbull[jbull])](OBBullMitigation<ibot)>=1
if breakoutbull then
$leftbull[jbull]=0
endif
endif
next
endif

////////////////////////////////////////////////////////////////////////////////////////////////////////////////
//     Drawing
////////////////////////////////////////////////////////////////////////////////////////////////////////////////

if islastbarupdate then
//plot the Bearish boxes
if  plot>0 then //islastbarupdate and
for j = plot-1 downto 0 //0 to plot-1
if $left[j]>0 then
drawrectangle($left[j],$top[j],barindex,$bottom[j]) coloured("red",Transparency)bordercolor("red",Transparency)
endif
next
endif
//plot the Bullish boxes
if  plotbull>0 then //islastbarupdate and
for jbull = plotbull-1 downto 0 //0 to plotbull-1
if $leftbull[jbull]>0 then
drawrectangle($leftbull[jbull],$bottombull[jbull],barindex,$topbull[jbull]) coloured("green",Transparency)bordercolor("green",Transparency)
endif
next
endif
endif

return
Download
Filename:
Supply-Demand-–-Order-Blocks.itf
Downloads:
1437
Veteran
Currently debugging life, so my bio is on hold. Check back after the next commit for an update.
Author’s Profile
Loading...