

Stop Reversal indicator
May 11, 2018, 7:48 AM
Indicators
13 Comments
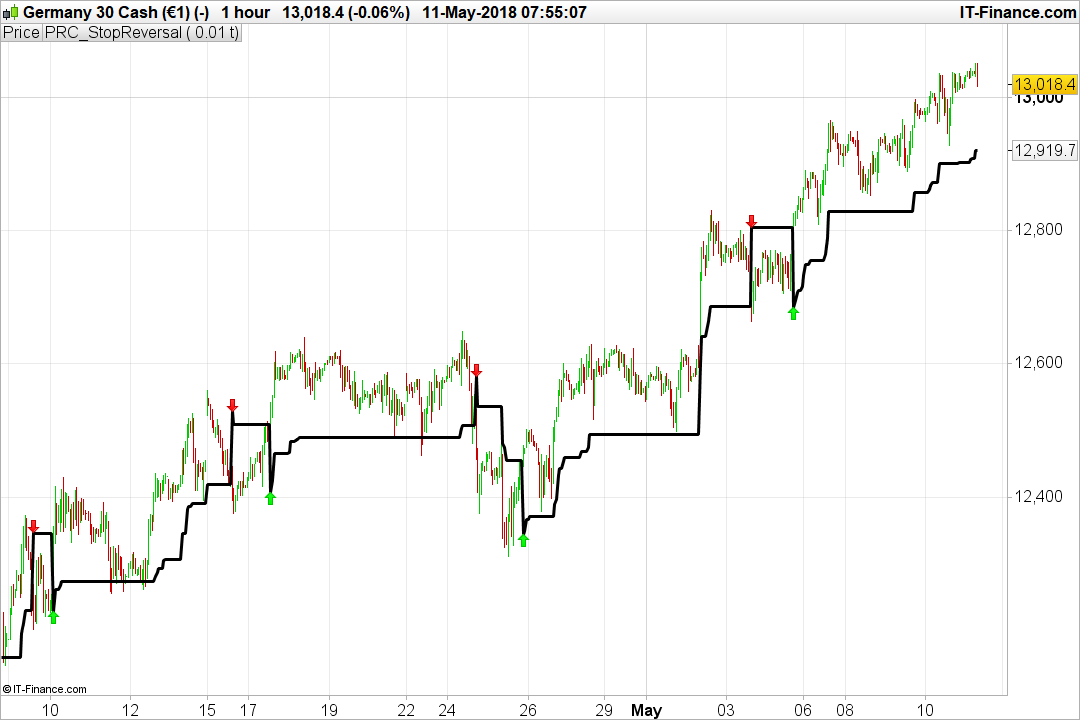
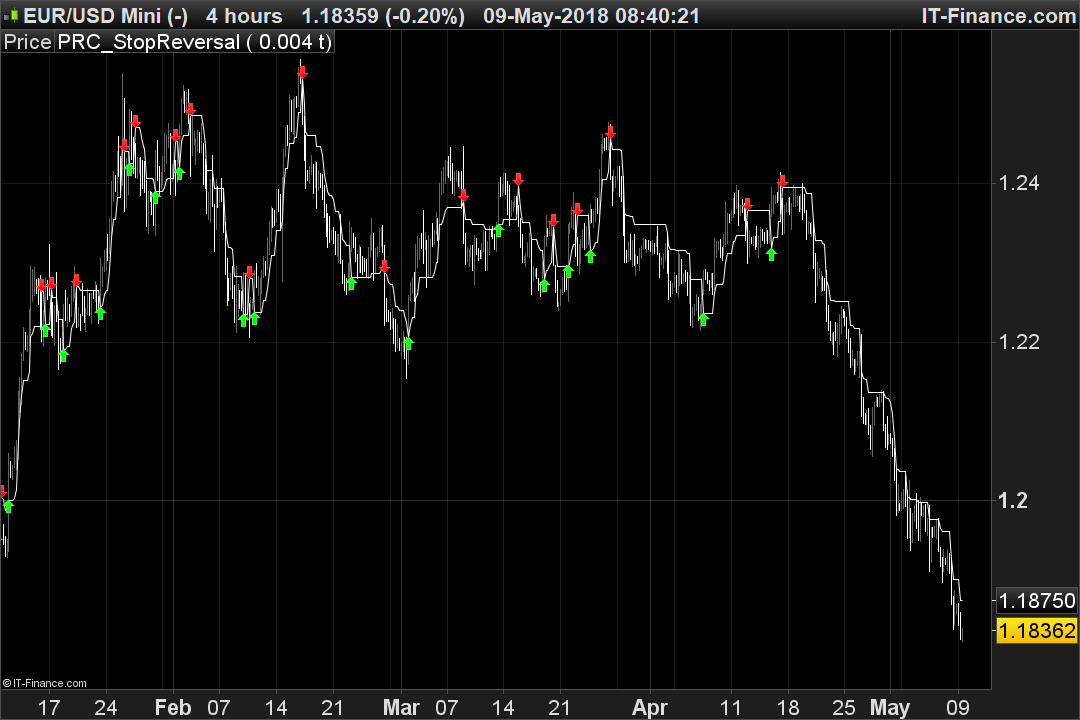
The indicator is pretty similar to a Supertrend but based on fixed steps with pips/points instead of multiple of ATR. The arrows plotted on the price chart are the reversal of this “supertrend”.
I added an option to display or not the line that show the trend and when the price is crossing it (showLine).
The “nPips” setting is the size in points/pips between the current close and the “stop and reverse” trend line. You should adapt it for the instrument and timeframe displayed on your chart.
//PRC_StopReversal | indicator
//09.05.2018
//Nicolas @ www.prorealcode.com
//Sharing ProRealTime knowledge

// --- settings
nPips = 0.004
showLine = 0 //0= false ; 1= true
// --- end of settings

if( (Close[0] = PREV) ) then
 TrStopLevel=PREV
elsif( (Close[1])<PREV and (Close[0]<PREV)  ) then
 TrStopLevel=Min(PREV,Close[0]*(1+nPips))
else
 if( ((Close[1])>PREV) and (Close[0]>PREV) ) then
  TrStopLevel=Max(PREV,Close[0]*(1-nPips))
 else
  if( (Close[0]>PREV) ) then
   TrStopLevel=Close[0]*(1-nPips)
  else
   TrStopLevel=Close[0]*(1+nPips)
  endif
 endif
endif

if( Close[0] > TrStopLevel and  Close[1]<PREV and PREV <>0 ) then
 drawarrowup(barindex,TrStopLevel) coloured(0,255,0)
endif


if( Close[0] < TrStopLevel and  Close[1]>PREV  and PREV <>0 ) then
 drawarrowdown(barindex,TrStopLevel) coloured(255,0,0)
endif


PREV=TrStopLevel

myline=undefined
if showline then
 myline=PREV
endif

return myline
Download
Filename:
PRC_StopReversal.itf
Downloads:
484
Download
Filename:
stopreversal-indicator.png
Downloads:
142
Master
I created ProRealCode because I believe in the power of shared knowledge. I spend my time coding new tools and helping members solve complex problems.
If you are stuck on a code or need a fresh perspective on a strategy, I am always willing to help. Welcome to the community!
Author’s Profile
Loading...