Stochastic RSI

Stochastic RSI

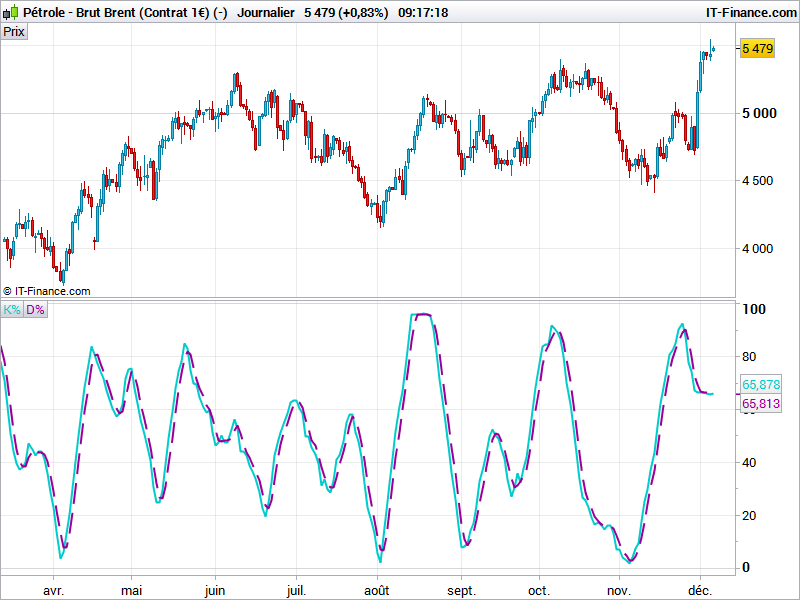
The stochastic RSI oscillator, applies RSI values instead of price into the stochastic formula.

Stochastic RSI = ((Today’s RSI – Lowest RSI Low in %K Periods) / (Highest RSI High in %K Periods – Lowest RSI Low in %K Periods)) * 100

Stochastic RSI measures the value of RSI in relation to its High and Low range over the required period:
when a regular RSI reaches a a new Low for the period, Stochastic RSI will be at 0. When RSI records a new high for the period, Stochastic RSI will be at 100.

This indicator was made by request on forum.


Share this

Risk disclosure:

No information on this site is investment advice or a solicitation to buy or sell any financial instrument. Past performance is not indicative of future results. Trading may expose you to risk of loss greater than your deposits and is only suitable for experienced investors who have sufficient financial means to bear such risk.

ProRealTime ITF files and other attachments : How to import ITF files into ProRealTime platform?

PRC is also on YouTube, subscribe to our channel for exclusive content and tutorials

  1. verdi55 • 12/06/2016 #

    Hello Nicolas,
    in what way does this indicator compare to the Stochastic RSI that is built-in into the PRT platform ? When I display the built-in indicator with a period of 10 units, I get a totally different picture. Do you know what the reason is ?

    • Nicolas • 12/06/2016 #

      I don’t know about the formula of the one built-in into the platform. This one has been converted from the tradingview platform as a request on forum, and it is totally similar to the original indicator.

  2. verdi55 • 12/06/2016 #

    I found the reason. The indicator built into the PRT platform displays only the StochRSI variable in your code, not the averages K and D. So I think, StochRSI is kind of a fast stochastic indicator, whereas the smoothed K% and D% in your code are the slow stochastic variety. Would you agree ? 

    • Nicolas • 12/06/2016 #

      Well, in this indi you can choose the RSI period, the period of the stochastic calculation of the RSI and the 2 smoothing periods K and D. 

  3. zakootajin • 12/06/2016 #

    Hi Nicolas,
    I am working on building a StochRSI indicator. My RSI and StochRSI values are correct but I am having an issue in matching the %K values with a trading platform. Could you tell me the formula for calculating the %K?

    • Nicolas • 12/06/2016 #

      The formula is the same as the above code. The K% is just the percentage of prive movement over a dynamic scale made by recent (periods) highest high and lowest low.

  4. AutoFlanders • 12/06/2016 #

    Thanks GraHal, that’s what i was looking for

avatar
Register or

Likes

avatar avatar avatar avatar avatar avatar
Related users ' posts
supertiti hola Ivan Eso quiere decir que el Parabolic sar RSI est igual al parabolic sar de PRT ? p...
supertiti buenas tardes Ivan me gusteria tener lo mismo on chart con los puntos azules y rosas de c...
LucasBest Thanks for the translation. This one can be compared to dynamic zone RSI
Iván
1 month ago
lee HI thank you for this indicator. Is it possible to create a screener based on this for when ...
luxrun grazie Ivàn!
lee Thank you. Is it possible to convert this to a screener that displays instruments when bulli...
Iván //---------------------------------------------------------------// //PRC_Pollan Indicator /...
Faisalx ChatGPT Hola Iván. Gracias por tu excelente trabajo. Te agradecería si pudieras echarle un...
Iván ok, perfecto! me pongo con ello
Iván Hi, Sorry, but what do you mean?
luiskohnen Hola, queria saber si el indicador repinta, porque a mi me parecio que si. Saludos y gracias...
Diamant Bonsoir, L'un d'entre vous peut-il me donner les définissions de LL-HH-LH et HL. Merci d'av...
Bernard13 (Je réécris mon commentaire -français- en français car certains mots ne correspondaient pas ...
Iván 1000 indicateurs !!! brutaux
Iván Gracias! Para el screener sólo tienes que copiar el indicador y poner como condición de búsq...
Lean Muchas gracias Iván, ya lo he podido crear.
bertoluce Hello Ivan, thank you very much for the indicator. An observation: would it be possible (and...
Bateson
2 years ago
Matriciel Very nice job ! Is it possible to do the opposite because what interests me is to have the ...
YvesRobert Hi Matriciel, how can we do this, because stochastic is limited between 0 and 100 but price ...
Traderfox06 Dear zeiiermantrading, I really like your approach combining adaptive averages with MACD in...
jacquesgermain Hello IASD it's normal , when this occurs, uncheck RSI and MFI line and click then the MAC...
emiliobercial Thank you very much for sharing!
Carlose estoy de acuerdo con IASD Esta muy bien el MAD y el indicador en el precio no se ven bien...
bousalahane merci pour le partage de cet l'indicateur, j'ai rajouté un autre indicateur pour faire une s...
joaoarcher Hi, thank you for the this. Is it possible to create a screener from this indicator, so that...
KumoNoJuzza Thanks. I did not know IG had Futures. I am always missing an info or a detail. I used to th...
joaoarcher Hi, thank you for the this. Is it possible to create a screener from this indicator, so that...
superfalcio Last very good gain of the system: positions on Eurostoxx50 closed yesterday friday 06/12/2024.
Nicolas
2 years ago
3 RSI
3 RSI
2
Indicators
Violet Nicolas, you calculate iRSI, but don't use it. You show RSI in the returned values, which, a...
Nicolas Yes, that's an error. RSI instruction is set by default to 14 if you don't indicate it that'...

Top