

Stiffness indicator
September 14, 2021, 8:32 AM
Indicators
3 Comments
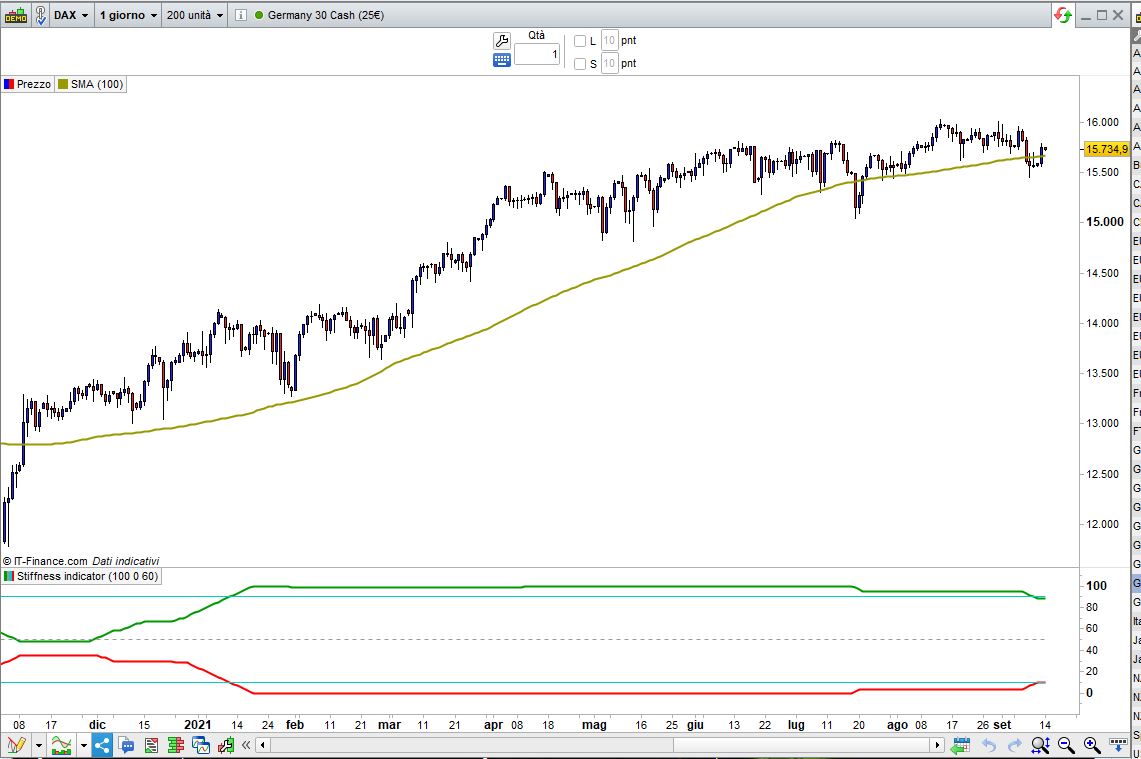
Stiffness indicator (by Markos Katsanos)
This indicator was first introduced in my November 2018 article in
Technical Analysis of STOCKS & COMMODITIES.
It basically attempts to recognize strong price trends by counting the number of times
that price was above the 100 day the moving average during the indicator period. The
premise is that the less times that price penetrates the moving average, the stronger
the trend is, suggesting less erratic prices in the future as well. I also introduced
a volatility threshold that excludes minimal penetrations of less than 0.2 standard deviations.
The default moving average is 100 days and the indicator period is 60 days.
//P    = 100                            //MA periods (defaults to 100)
//T    = 0                              //Average type (0=sma):
//                                      //  (https://www.prorealcode.com/documentation/average/)
//LB   = 60                             //LookBack periods
P      = max(1,min(999,P))              //range allowed: 1-999
LB     = max(1,min(999,LB))             //range allowed: 1-999
T      = max(0,min(8,T))                //available average types: 0-8
//
Sma100 = Average[P,T](close)            //calculate SMA
SmaL   = Sma100 + (0.2 * STD[P](close)) //add a buffer for LONG trends
SmaS   = Sma100 - (0.2 * STD[P](close)) //subtract a buffer for SHORT trends
//
ContoL = summation[LB](close > SmaL)    //tally how many times CLOSE was above SMA in the LB period
ContoS = summation[LB](close < SmaS)    //tally how many times CLOSE was below SMA in the LB period
//
StiffL = 100 * (ContoL / LB)            //UPtrend %
StiffS = 100 * (ContoS / LB)            //DOWNtrend %
RETURN StiffL AS "UPtrend %",StiffS AS "DOWNtrend %",90 AS "90",10 AS "10",50 as "50"
Download
Filename:
Stiffness-custom-indicator.itf
Downloads:
282

Master
Roberto
https://www.ots-onlinetradingsoftware.com
Author’s Profile
Loading...