

Squeeze Momentum Indicator
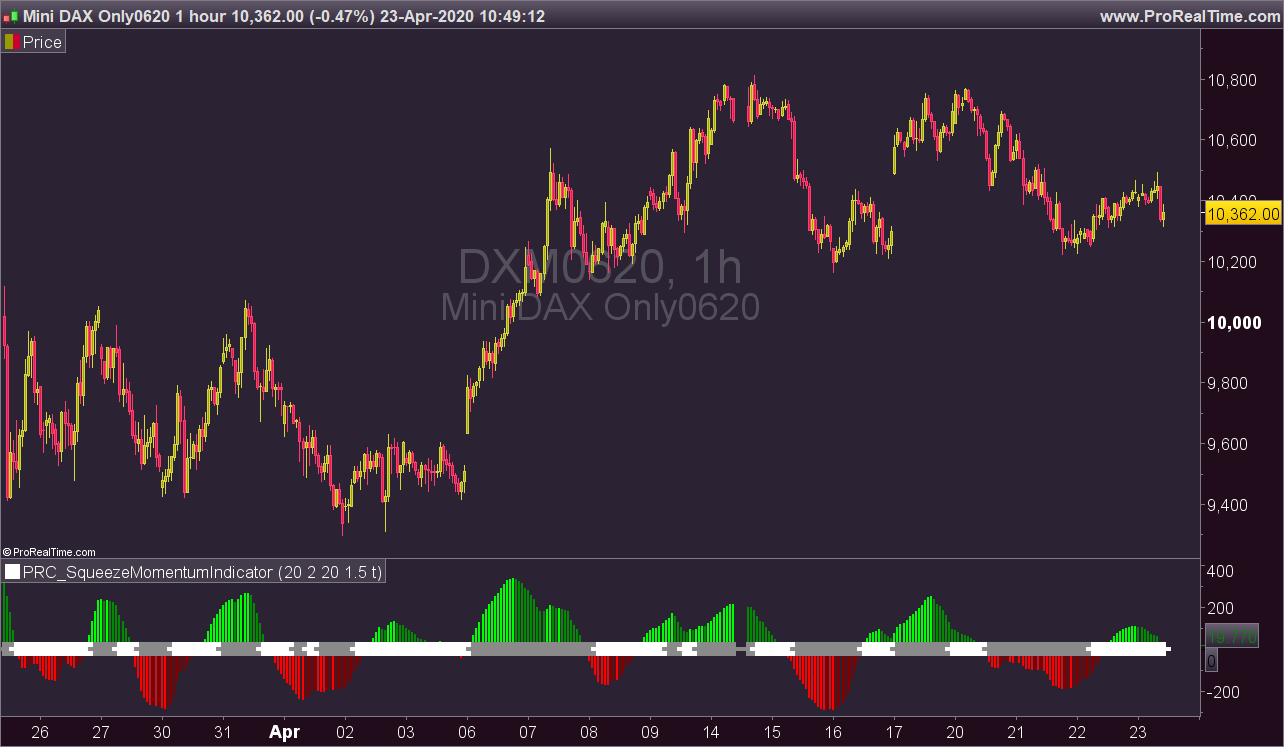
This is a derivative of John Carter’s “TTM Squeeze” volatility indicator, as discussed in his book “Mastering the Trade” (chapter 11).
Black (or white) crosses on the midline show that the market just entered a squeeze ( Bollinger Bands are with in Keltner Channel). This signifies low volatility , market preparing itself for an explosive move (up or down). Gray crosses signify “Squeeze release”.
Mr.Carter suggests waiting till the first gray after a black cross, and taking a position in the direction of the momentum (for ex., if momentum value is above zero, go long). Exit the position when the momentum changes (increase or decrease — signified by a color change). My (limited) experience with this shows, an additional indicator like ADX / WaveTrend, is needed to not miss good entry points. Also, Mr.Carter uses simple momentum indicator , while I have used a different method (linreg based) to plot the histogram.
More info:
– Book: Mastering The Trade by John F Carter
(Description from the original author of this indicator LazyBear, all credits go to him).
//PRC_SqueezeMomentumIndicator | indicator
//23.04.2020
//Nicolas @ www.prorealcode.com
//Sharing ProRealTime knowledge
//converted from Pinescript version

// --- settings
length = 20 //BB Length
mult = 2.0 //BB MultFactor
lengthKC= 20 //KC Length
multKC = 1.5 //KC MultFactor
useTrueRange = 1 //0=false;1=true Use TrueRange (KC)
// --- end of settings

// Calculate BB
source = customclose
basis = average[length](source)
dev = multKC * std[length](source)
upperBB = basis + dev
lowerBB = basis - dev

// Calculate KC
ma = average[lengthKC](source)
if useTrueRange then
 irange = tr
else
 irange = (high - low)
endif
rangema = average[lengthKC](irange)
upperKC = ma + rangema * multKC
lowerKC = ma - rangema * multKC

sqzOn = (lowerBB > lowerKC) and (upperBB < upperKC)
sqzOff = (lowerBB < lowerKC) and (upperBB > upperKC)
noSqz = (sqzOn = 0) and (sqzOff = 0)

data = source - (highest[lengthKC](high)+lowest[lengthKC](low)+average[lengthKC](close))/3
val = linearregression[lengthKC](data)

//histogram color
if val>0 then
 if val>val[1] then
  r=0
  g=255
 else
  r=0
  g=139
 endif
else
 if val<val[1] then
  r=255
  g=0
 else
  r=128
  g=0
 endif
endif

//squeeze color
if noSqz then
 sr=0
 sg=0
 sb=255
elsif sqzOn then
 sr=0
 sg=0
 sb=0
else
 sr=138
 sg=138
 sb=138
endif
drawtext("✚",barindex,0,dialog,standard,20) coloured(sr,sg,sb)

return 0 coloured(sr,sg,sb) style (histogram,2), val coloured(r,g,0) style(histogram,4)