

Sniper T3-CCI
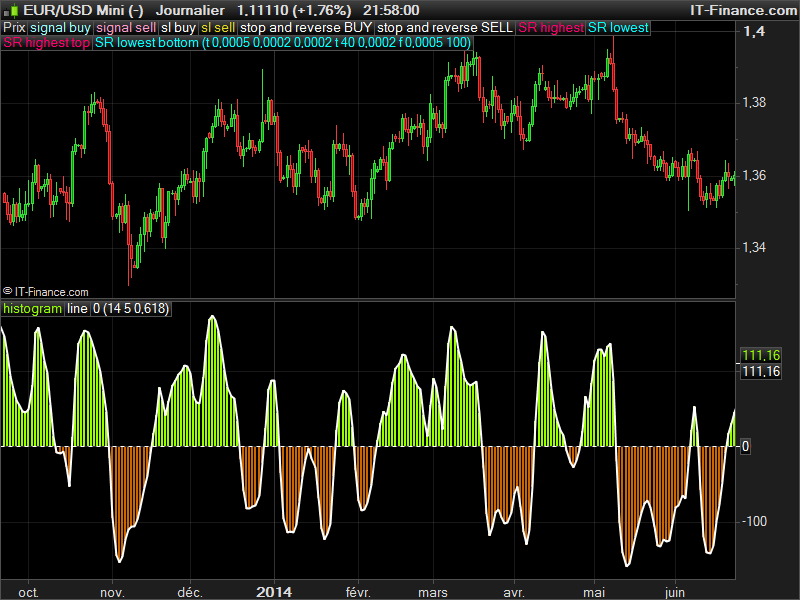
This indicator is well known one all over the internet, mainly build around the CCI indicator, this oscillator gives buy and sell signals while crossing over and under the zero line.
Found this strategy description also :
This system is very simple to follow – Use FX Sniper T3 CCI as your main strategy.
Enter when the SECOND red or green bar appears and Exit when the blue line crosses zero line.
You can actually enter a trade on the 1st bar ( do not wait for a second bar ) but in this case your
entry signal will be not confirmed.
Place your stop loss 2-3 pips below ( when buy) 2-3 pips above ( when sell) of the previous candle.
An opposite rule works for the sell orders.
Timeframes: M15 to 4H
Pairs: All major pairs.
Try this simple system and you will be impressed how powerful it is.
Happy trading
//parameters
//CCIperiod = 14
//T3period = 5
//b = 0.618

if(barindex>CCIperiod) then
xPrice = Close
b2=b*b
b3=b2*b
c1=-b3
c2=(3*(b2+b3))
c3=-3*(2*b2+b+b3)
c4=(1+3*b+b3+3*b2)

nr=1+0.5*(T3period-1)
w1=2/(nr+1)
w2=1-w1

xcci= CCI[CCIperiod](xPrice)

e1 = w1*xcci + w2*(e1[1])
e2 = w1*e1 + w2*(e2[1])
e3 = w1*e2 + w2*(e3[1])
e4 = w1*e3 + w2*(e4[1])
e5 = w1*e4 + w2*(e5[1])
e6 = w1*e5 + w2*(e6[1])

xccir = c1*e6+c2*e5+c3*e4+c4*e3
xccirline = c1*e6+c2*e5+c3*e4+c4*e3
endif

RETURN xccir as "histogram", xccirline as "line", 0 as "0"
Code is adapted from H.POTTER one from tradingview