







Smart Money Interest – Tracking Institutional Flow
Understanding the flow of money is one of the distinct edges a trader can have. The Smart Money Interest indicator is designed to visualize the battle between “Smart Money” (institutional, informed investors) and “Dumb Money” (retail, emotional investors).
Developed based on concepts by AlgoAlpha and adapted for ProRealTime, this tool uses volume analysis to determine who is currently controlling the price action.
The Theory: PVI vs. NVI
To understand this indicator, we must understand the conventional volume theory it relies on:
-
Dumb Money (Positive Volume Index – PVI): Conventional wisdom suggests that “uninformed” money typically chases price. They are most active on days with high volume (spikes), reacting emotionally to news or rapid price moves.
-
Smart Money (Negative Volume Index – NVI): Institutional investors typically accumulate or distribute positions quietly. They tend to be most active on days with lower volume, preventing their large orders from slipping the price too much.
How it Works
The Smart Money Interest indicator calculates both the PVI and NVI. It then smooths these values and applies a Relative Strength Index (RSI) to both to normalize their movements.
Finally, it creates a Ratio between the Smart Money RSI and the Dumb Money RSI.
-
If the ratio increases, Smart Money is exerting more influence than Dumb Money.
-
If the ratio decreases, Dumb Money (retail flow) is dominant.
Interpreting the Visuals
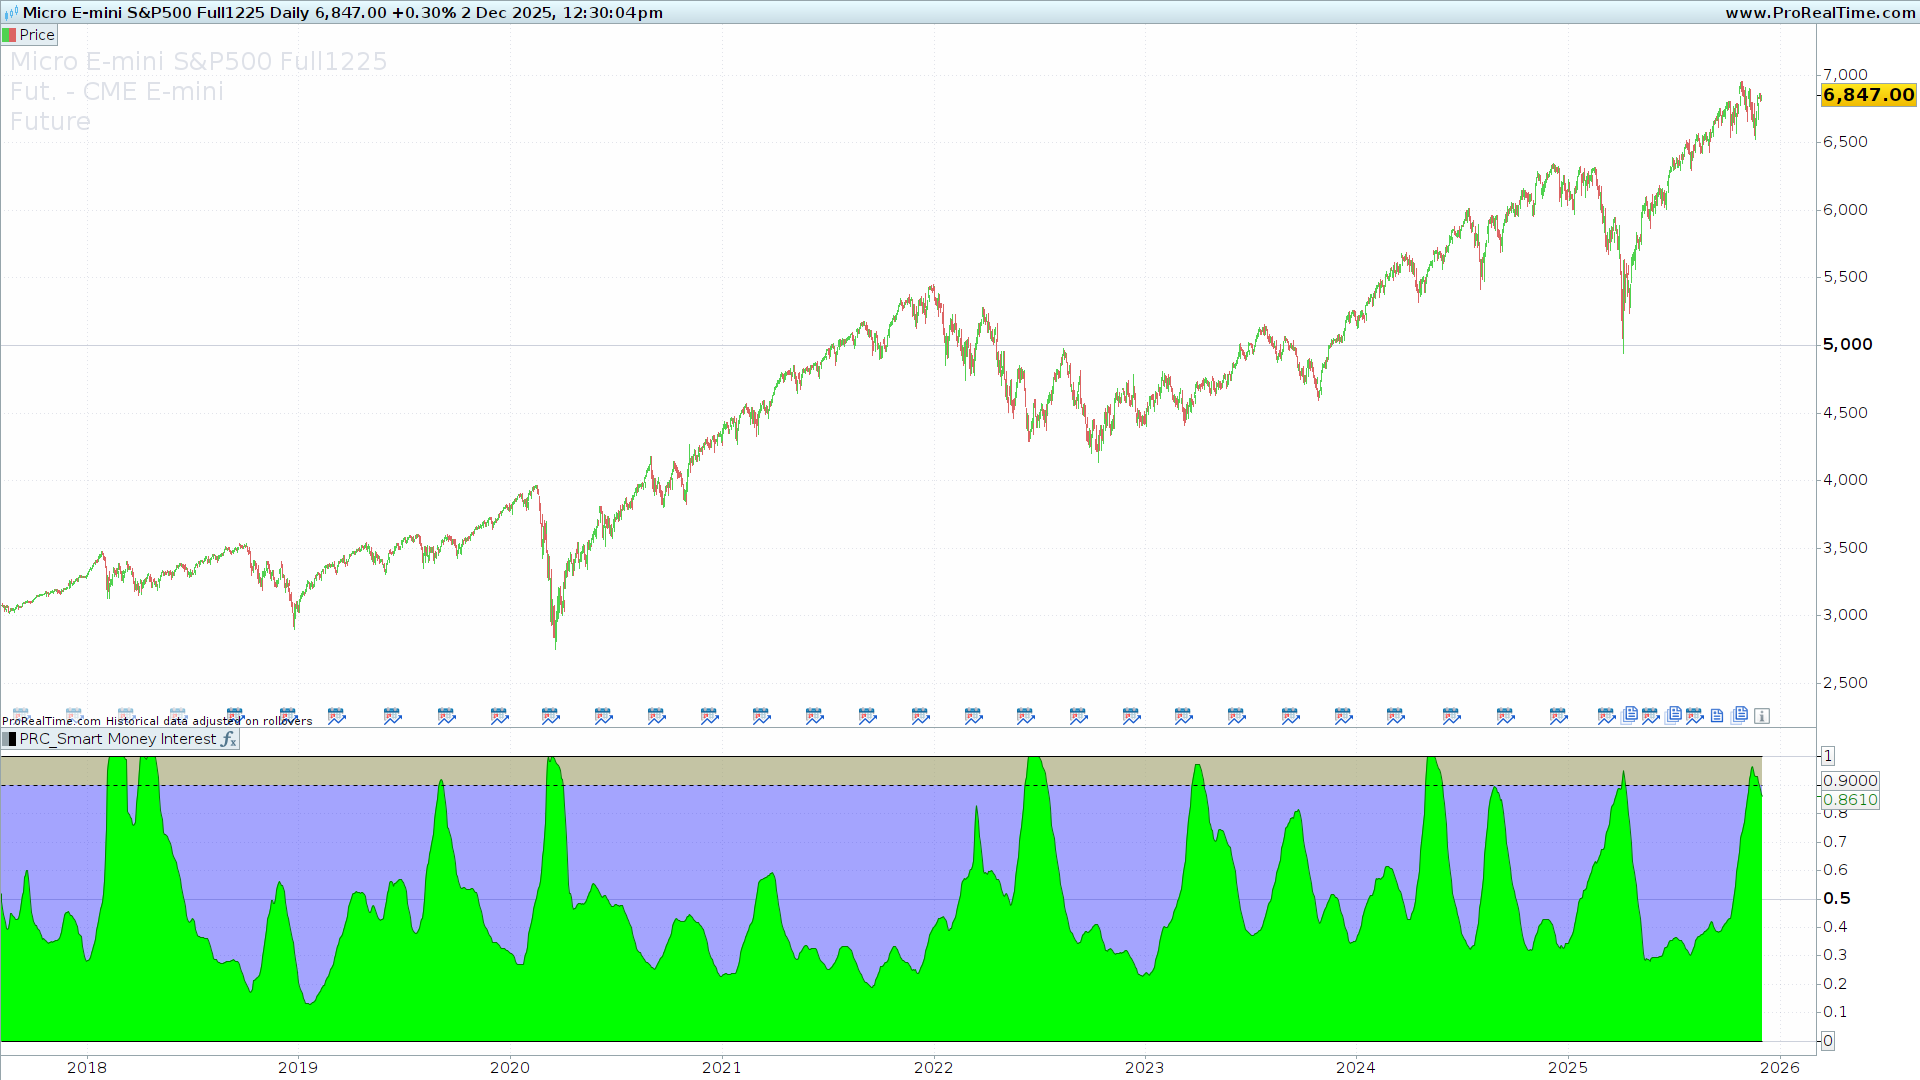
The indicator plots a normalized oscillator (The Green Line) against a blue background.
-
The Green Line (Smart Money Index): When this line is rising, it indicates that Smart Money interest is increasing relative to Dumb Money. This is often seen as a confirmation of a healthy trend or a signal of quiet accumulation before a move.
-
The Yellow Zone (Threshold): The indicator includes a configurable threshold (default 0.9). When the Green Line crosses into this yellow zone, it indicates High Smart Money Interest. This extreme reading often highlights areas where institutions are heavily active, potentially preceding a breakout or a significant trend continuation.
Settings and Configuration
You can fine-tune the indicator to fit your timeframe and asset class using the following variables:
-
Index Period (x): (Default: 25) This controls the summation period for the ratio. Increasing this value makes the indicator smoother but slower to react. Decreasing it makes it more sensitive to short-term volume changes.
-
Volume flow period (rr): (Default: 14) This is the lookback period for the RSI calculation applied to the volume indices.
-
Normalization period (peakslen): (Default: 500) This determines the historical range used to find the “peak” value for normalization. It ensures the index stays within a readable scale relative to recent history.
-
High interest Threshold (thr): (Default: 0.9) The level at which the background turns yellow. If you want to see only the most extreme institutional activity, increase this value (e.g., to 0.95).
The ProBuilder Code
//---------------------------------------------------------//
//PRC_Smart Money Interest by AlgoAlpha
//version = 0
//18.04.24
//Iván González @ www.prorealcode.com
//Sharing ProRealTime knowledge
//--------------------------------------------------------//
//-----Inputs---------------------------------------------//
x=25//Index Period
rr=14//Volume flow period
peakslen=500//Normalization period
thr=0.9//High interest Threshold
//--------------------------------------------------------//
//-----Smart money and Dumb Money Calculation-------------//
dumb=PositiveVolumeIndex(close)-average[255,1](PositiveVolumeIndex(close))
smart=negativevolumeindex(close)-average[255,1](negativevolumeindex(close))
//--------------------------------------------------------//
//-----RSI Smart money and Dumb Money---------------------//
drsi=rsi[rr](dumb)
srsi=rsi[rr](smart)
//--------------------------------------------------------//
//-----Ratio Smart vs Dumb Money--------------------------//
//Shows if smart money is buying from dumb money selling and vice versa
r=srsi/drsi
sums=summation[x](r)
peak=highest[peakslen](sums)
myindex=sums/peak
//--------------------------------------------------------//
//-----Plot and color-------------------------------------//
btm=0
tp=1
colorbetween(btm,tp,"blue",90)
colorbetween(thr,tp,"yellow",90)
colorbetween(myindex,btm,"lime")

return myindex as "Index"coloured("Green"),btm as "Bottom", tp as "Top"style(line), thr as "Threshold" style(dottedline)
Comments
You must be logged in to post a comment.



Regarding the strange behaviour in the daily chart, the variable called "index" when I start increasing peakslen starts to become greater than 1. It seems it reaches a value that can't be shown in the chart. If I set peakslen=500 in the daily chart I just see a kind of green bar on the screen (index much more greater than 1), if I decrease peakslen at 100 the indicator seems to work from the 1st of may 2024 until today (for days before the 1st of may 2024 the indicator becomes like a green bar with enormous values of the index variable. Thanks in advance if you can fix the code or help me to set the indicator. It seems very interesting for swing trading.
Hi Ivan, the indicator is not drawed correctly. If i set peakslen=500 I just see a green bar on the screen. If I set peakslen=100, I start seeing "green mountains", but the behaviour relative to the stock chart is not as expected. Which are the best settings for weekly charts in your opinion? Thanks in advance
https://www.prorealcode.com/topic/ath-luxalgo-conversion-ivan/