

Simple "Buy / Sell" indicator
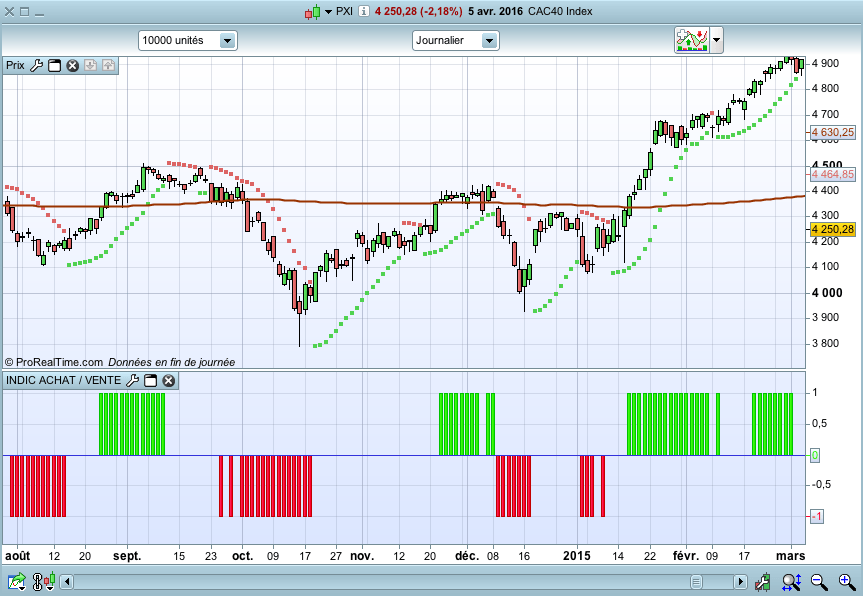
This little and simple code allows you to draw an indicator, which show you when buy or sell conditions are met.
For “buy” conditions, I did just set :
close > MM200
close > Parabolic SAR
MACD > 0
RSI14 > 50
For “sell” conditions : the opposite.
Of course, you can set what you want, in order to test your strategies.
Of course, to be profitable, you must also set your trading rules (entry, stop loss, trailing stop, take profit, etc.)
It’s only an indicator, which doesn’t show entry or exit rules.
You can test it with a trailing stop, it seems too be profitable !
ACHAT = 0
VENTE = 0

PSAR = SAR[0.02,0.02,0.2]
c1a = close > PSAR
c1v = close < PSAR

MM200 = Average[200](close)
c2a = close > MM200
c2v = close < MM200

IndicMACD = MACD[12,26,9](close)
c3a = (IndicMACD >= 0)
c3v = (IndicMACD <= 0)

RSI14 = RSI[14](close)
c4a = (RSI14 >= 50)
c4v = (RSI14 <= 50)

IF c1a AND c2a AND c3a AND c4a THEN
ACHAT = 1
ENDIF

IF c1v AND c2v and c3v AND c4v THEN
VENTE = -1
ENDIF

RETURN ACHAT as "ACHAT", VENTE as "VENTE"
In order to have the same, you must go to “properties”, and set “achat” and “vente” to histograms (and set the colors green and red), add an horizontal line (value 0).
Happy trading !