

Setup´s Lines with pivot points
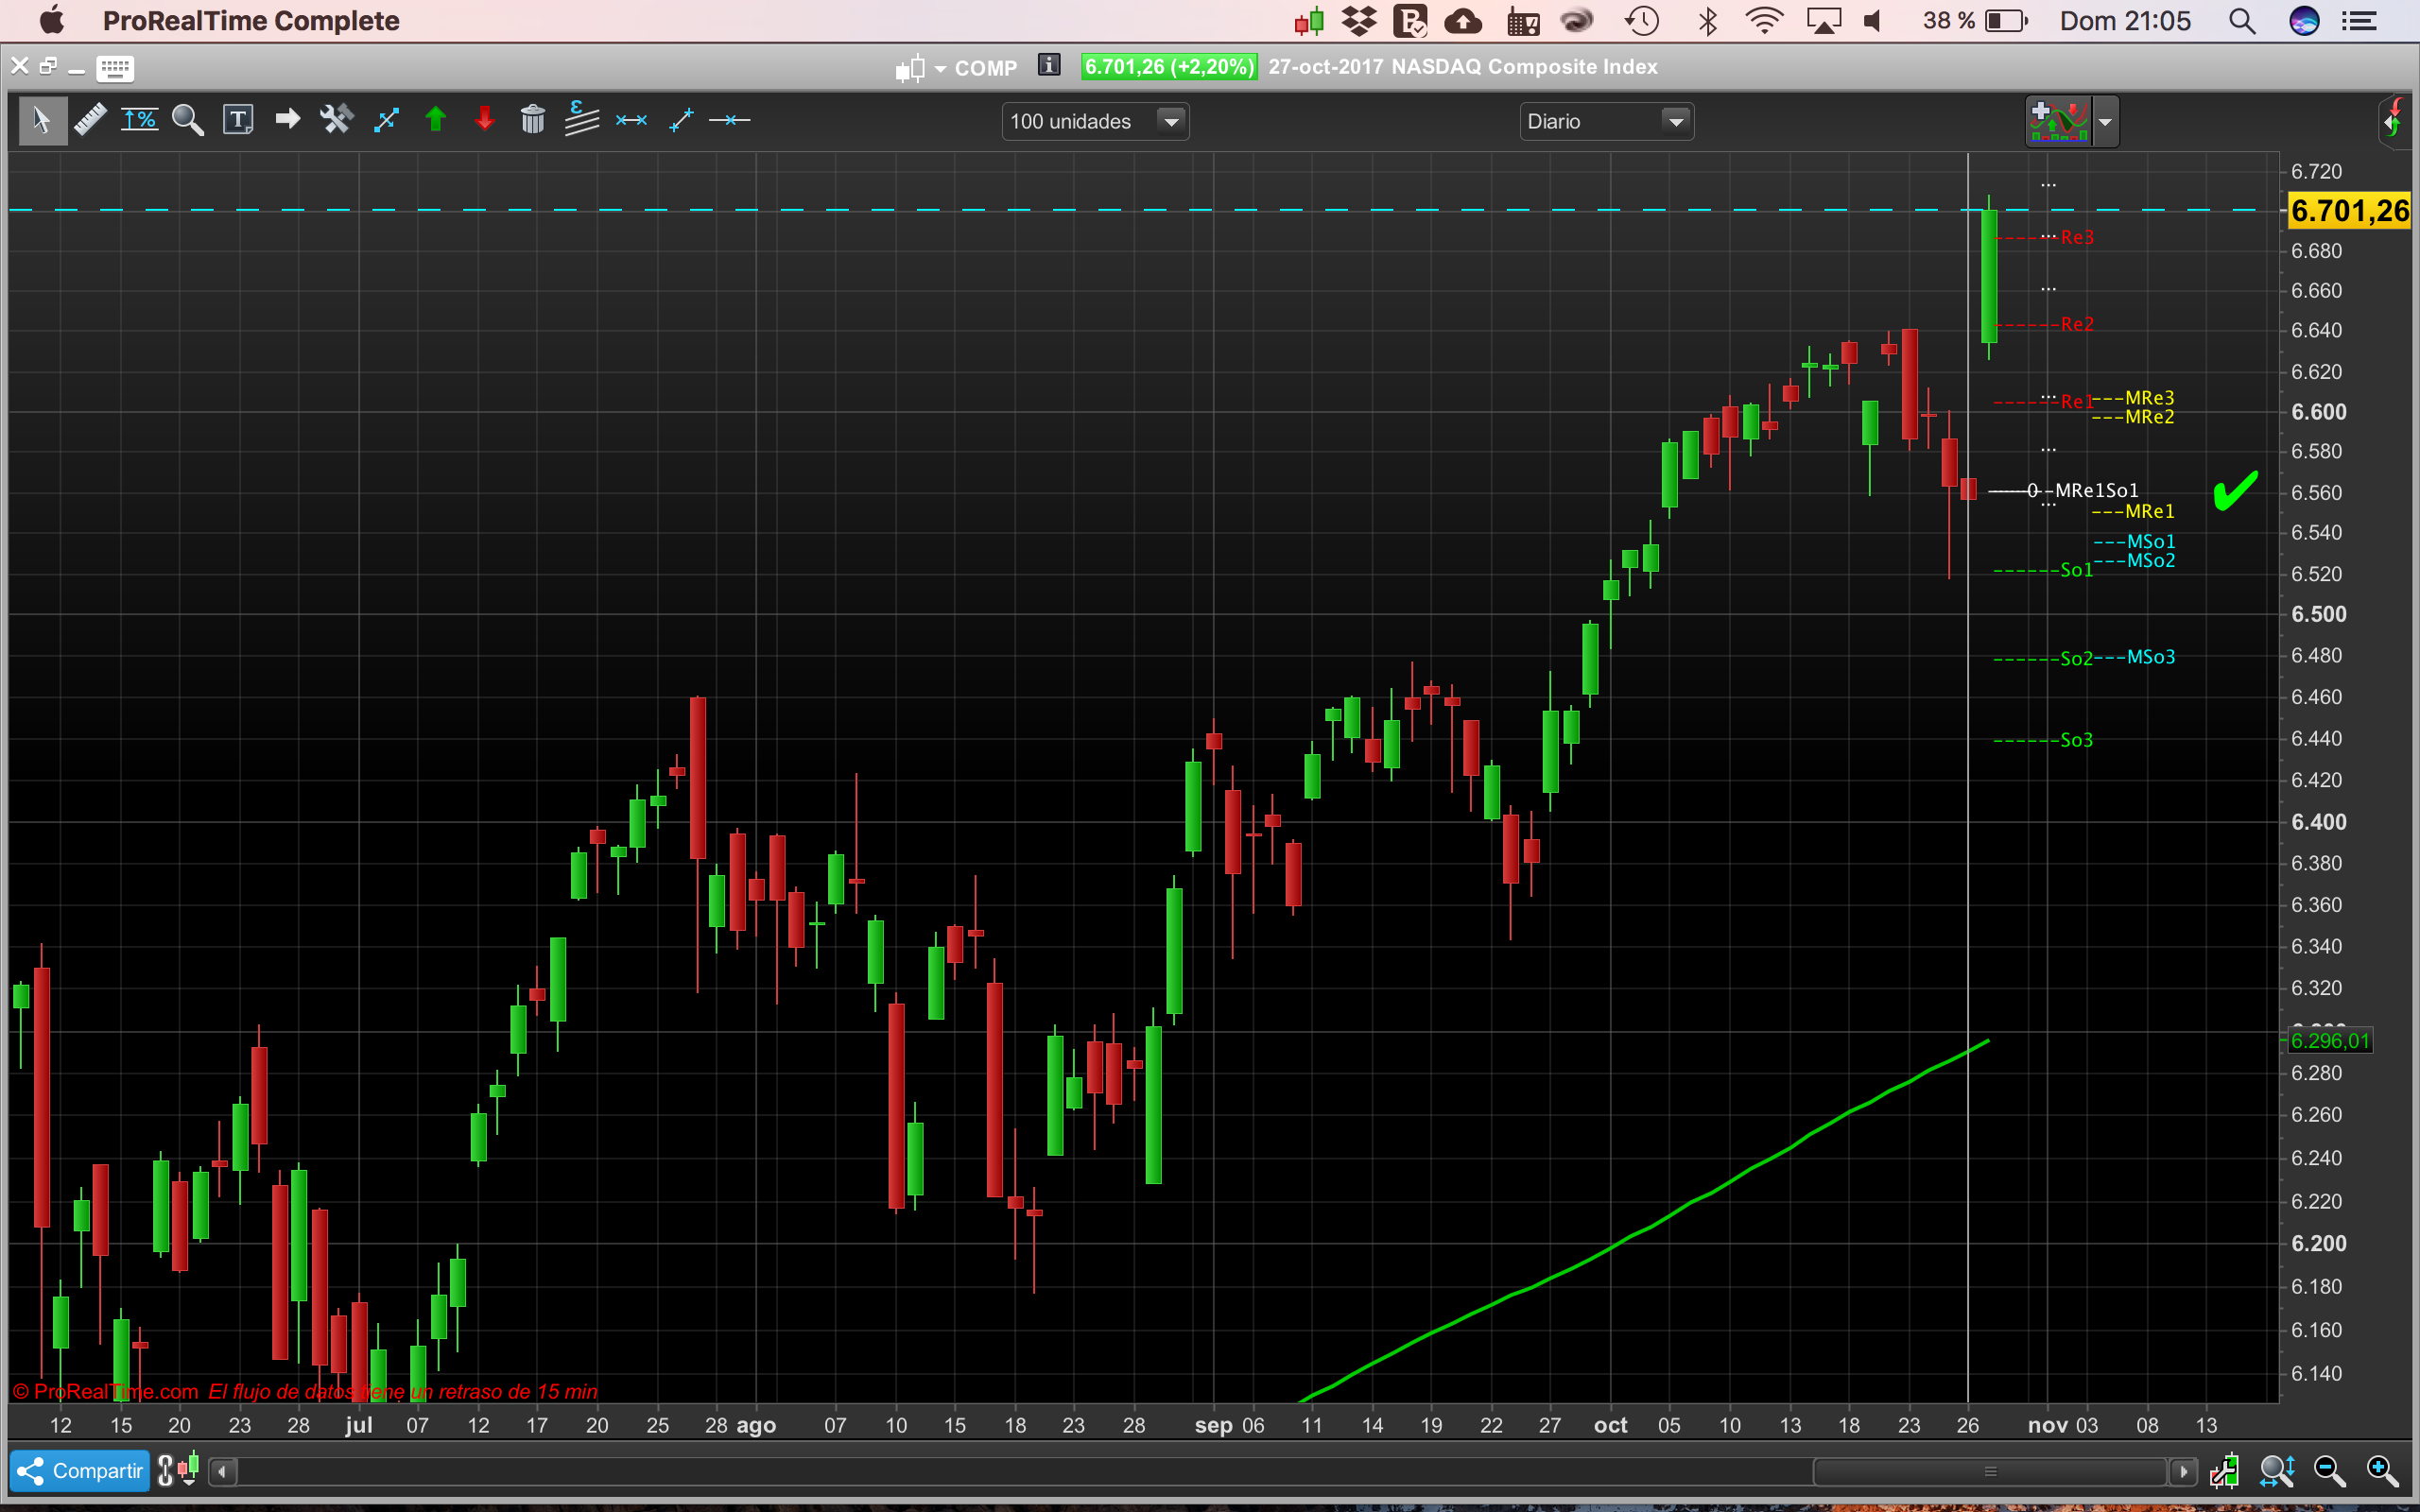
Today I want to share with you this indicator that has already been created for a long time and that is based on Pivot points. I’m not going to explain how it works because I have it in disuse and I do not remember how it worked exactly but it may be that someone is useful.
“Dedicate your energies to the creation of good indicators, instead of trying to predict the movement of the market, and that way you can get to survive”
APPEL, GERALD
Hoy quiero compartir con ustedes este indicador que ya cree hace tiempo y que esta basado en los puntos Pivote. No os voy a explicar como funciona porque lo tengo en desuso y ya no me acuerdo como funcionaba exactamente pero puede que a alguien le sea de utilidad.
“Dedica tus energías a la creación de unos buenos indicadores, en vez de intentar predecir el movimiento del mercado, y de esa forma podrás conseguir sobrevivir”
APPEL, GERALD
//---settings
//Rewind = 0
//ConstantePrecio = 1 //(1=weightedclose 2=Totalprice 3=Typicalprice 4=Medianprice)
//LineAnalisis=1
//---

Defparam DRAWONLASTBARONLY = True


If ConstantePrecio = 1 then
 Price = Weightedclose
elsif ConstantePrecio = 2 then
 Price = Totalprice
elsif ConstantePrecio = 3 then
 Price = Typicalprice
elsif ConstantePrecio = 4 then
 Price = Medianprice
elsif ConstantePrecio = 5 then
 Price = close
else
 Price = Typicalprice
endif

If LineAnalisis = 1 then
 DRAWVLINE(barindex[1+Rewind]) coloured (160,160,160)
else
endif

pp = price[1+Rewind]
MRe1  = (pp + Re1) / 2
Re1  = pp + (pp - Low[2+Rewind])
MRe2 = (Re1 + Re2) / 2
Re2  = pp + (High[2+Rewind] - Low[2+Rewind])
MRe3 = (Re2 + Re3) / 2
Re3  = High[2+Rewind] + 2*(pp - Low[2+Rewind])


MRe1So1=pp + (pp - price[2+Rewind])


MSo1 = (pp + So1) / 2
So1  = pp - (High[2+Rewind] - pp)
MSo2 = (So1 + So2) / 2
So2  = pp - (high[2+Rewind] - Low[2+Rewind])
MSo3 = (So2 + So3) / 2
So3  = Low[2+Rewind] - 2*(high[2+Rewind] - pp)

//==========================================================


DRAWTEXT("                     ···", barindex, (open + (open*0.004)))
DRAWTEXT("                     ···", barindex, (open + (open*0.008)))
DRAWTEXT("                     ···", barindex, (open + (open*0.012)))
//
DRAWTEXT("                     ···", barindex, (open - (open*0.004)))
DRAWTEXT("                     ···", barindex, (open - (open*0.008)))
DRAWTEXT("                     ···", barindex, (open - (open*0.012)))
//===========================================================
//DRAWSEGMENT(barindex[1], pp, barindex[0], pp)
DRAWTEXT("         ---0", barindex, pp)

//DRAWSEGMENT(barindex, MRe1So1, barindex[1], MRe1So1)
DRAWTEXT("                          ------MRe1So1", barindex, MRe1So1)

//DRAWSEGMENT(barindex, open, barindex[1], open)
//DRAWTEXT("                    ------Open", barindex, open)

//DRAWSEGMENT(barindex, MRe1, barindex[1], Mre1) coloured (102,102,102)
DRAWTEXT("                                                   ---MRe1", barindex, MRe1) coloured (255,255,0)

//DRAWSEGMENT(barindex, Re1, barindex[1], Re1) coloured (255,0,0)
DRAWTEXT("                   ------Re1", barindex, re1) coloured (255,0,0)

//DRAWSEGMENT(barindex, MRe2, barindex[1], Mre2) coloured (102,102,102)
DRAWTEXT("                                                   ---MRe2", barindex, MRe2) coloured (255,255,0)

//DRAWSEGMENT(barindex, Re2, barindex[1], Re2)coloured (255,0,0)
DRAWTEXT("                   ------Re2", barindex, re2)coloured (255,0,0)

//DRAWSEGMENT(barindex, MRe3, barindex[1], MRe3) coloured (102,102,102)
DRAWTEXT("                                                   ---MRe3", barindex, MRe3) coloured (255,255,0)

//DRAWSEGMENT(barindex, Re3, barindex[1], Re3)coloured (255,0,0)
DRAWTEXT("                   ------Re3", barindex, re3)coloured (255,0,0)

//DRAWSEGMENT(barindex, MSo1, barindex[1], MSo1) coloured (102,102,102)
DRAWTEXT("                                                   ---MSo1", barindex, MSo1) coloured (0,255,255)

//DRAWSEGMENT(barindex, So1, barindex[1], So1)coloured (0,255,0)
DRAWTEXT("                   ------So1", barindex, So1)coloured (0,255,0)

//DRAWSEGMENT(barindex, MSo2, barindex[1], MSo2) coloured (102,102,102)
DRAWTEXT("                                                   ---MSo2", barindex, MSo2) coloured (0,255,255)

//DRAWSEGMENT(barindex, So2, barindex[1], So2)coloured (0,255,0)
DRAWTEXT("                   ------So2", barindex, So2)coloured (0,255,0)

//DRAWSEGMENT(barindex, MSo3, barindex[1], MSo3) coloured (102,102,102)
DRAWTEXT("                                                   ---MSo3", barindex, MSo3) coloured (0,255,255)

//DRAWSEGMENT(barindex, So3, barindex[1], So3)coloured (0,255,0)
DRAWTEXT("                   ------So3", barindex, So3)coloured (0,255,0)

//X = 12

//If close[1+Rewind] > highest[3+Rewind](high[2+Rewind]) then
//DRAWTEXT("⊼", barindex[x], low,Dialog,Standard,30) coloured (0,255,0)
//DRAWELLIPSE(barindex[x-1], low+(low*0.002), barindex[x+1], low-(low*0.002)) coloured (102,102,102)

//elsif close[1+Rewind] < lowest[3+Rewind](low[2+Rewind]) then
//DRAWTEXT("⊻", barindex[x], High,Dialog,Standard,30) coloured (255,0,0)
//DRAWELLIPSE(barindex[x-1], high-(high*0.002), barindex[x+1], high+(high*0.0015)) coloured (102,102,102)

//else
//DRAWTEXT("⇅", barindex[10], close,Dialog,Standard,15) coloured (0,255,255)
//DRAWTEXT("⊼", barindex[x], low,Dialog,Standard,30) coloured (0,255,0)
//DRAWTEXT("⊻", barindex[x], High,Dialog,Standard,30) coloured (255,0,0)
//DRAWELLIPSE(barindex[x-1], low+(low*0.002), barindex[x+1], low-(low*0.002)) coloured (102,102,102)
//DRAWELLIPSE(barindex[x-1], high-(high*0.002), barindex[x+1], high+(high*0.0015)) coloured (102,102,102)
//endif


If Re1 > MRE1So1 and Re2 > Re1 and Re3 > Re2 And So1 < Mre1so1 and so2 < so1 and so3 < so2 then
 DRAWTEXT("                          ✔", barindex, MRe1So1,Dialog,Standard,30) coloured (0,255,0)
else
 DRAWTEXT("                          ✗", barindex, MRe1So1,Dialog,Standard,30) coloured (255,0,0)
endif


return


//(0, 0, 0)negro   ⁉  ⇡ ⇣  ⁈   ⁈
//(255, 255, 255)blanco
//(255, 0, 0)rojo
//(0, 255, 0)verde
//(0, 0, 255)azul
//(255, 255, 0)amarillo
//(0, 255, 255)azul celeste
//(255, 0, 255)añil