

Session Candles Only
October 22, 2019, 3:38 PM
Indicators
1 Comment
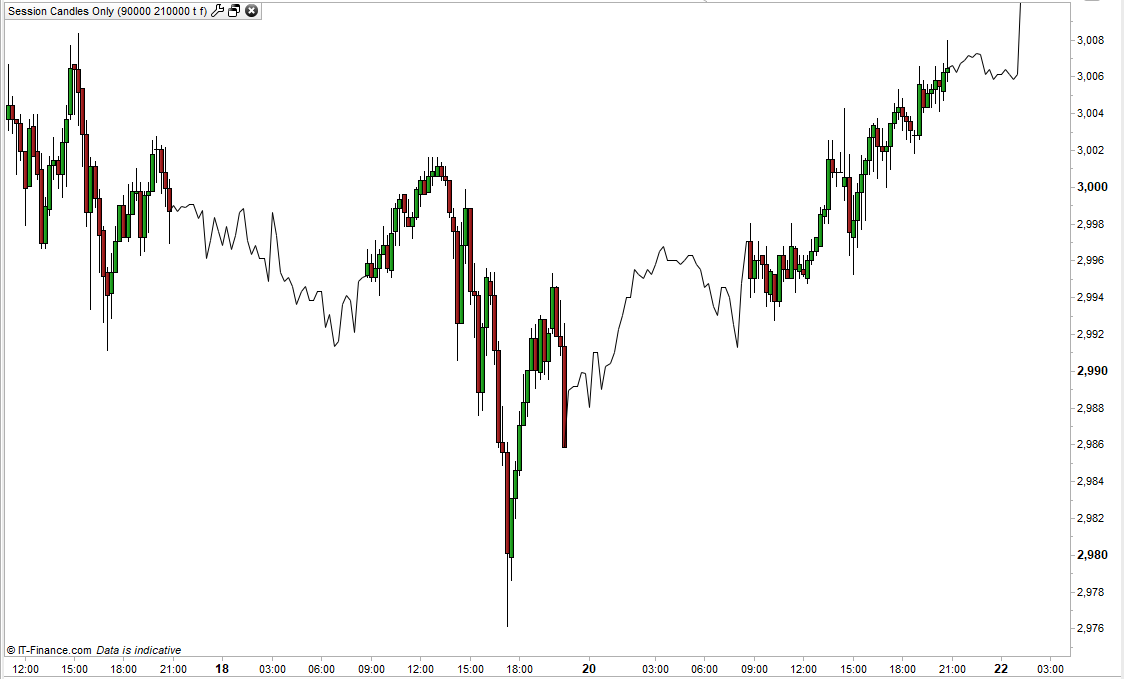
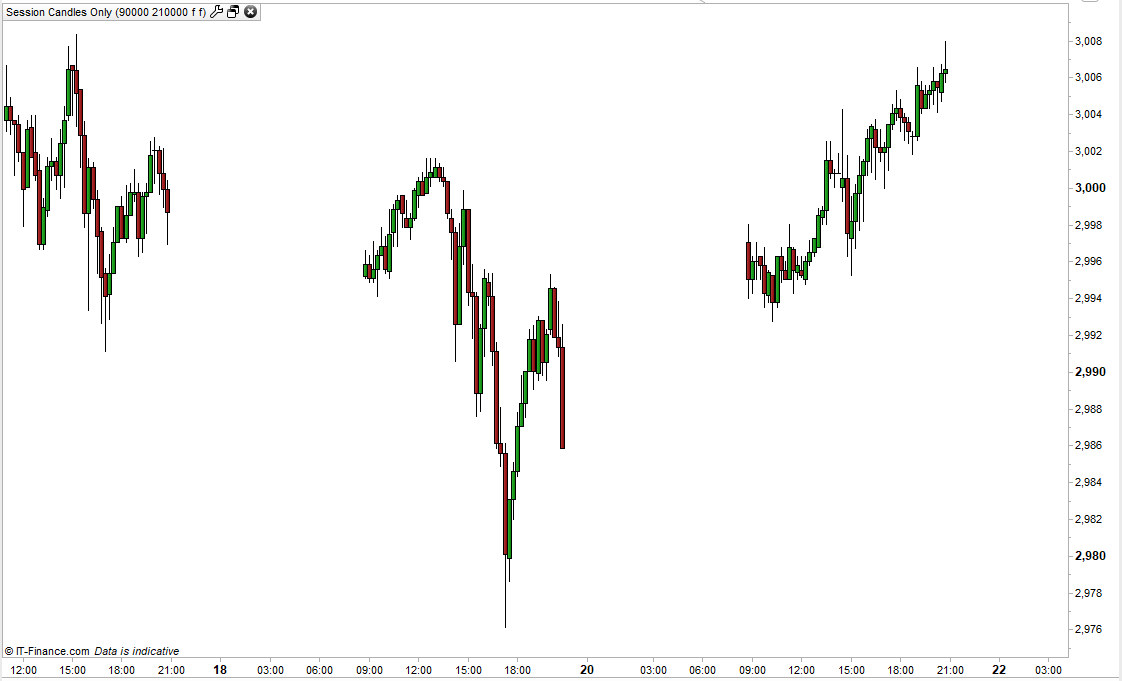
This simple indicator allows you to display candles only if they are between set times. This allows you to remove any out of trading hours candles to make the chart clearer.
You have the option to leave the out of session space on the chart blank or to draw a line connecting the closing prices.
You can also display the out of session candles if you want to. Tick or untick OOHLine and OOHCandles to change the display.
Set the StartTime and EndTime variables to your desired trading session hours start and end times.
As always I advise downloading the ITF file and importing it to ensure full functionality.
//Session Candles Only
//By Vonasi
//20191022

//starttime = 090000
//endtime = 210000

r = 128
g = 0
if close > open then
r = 0
g = 128
endif

if opentime >= starttime and opentime <= endtime then
 if opentime = starttime and oohline  and not oohcandles then
  drawsegment(barindex,open,barindex-1,close[1]) COLOURED(0,0,0)
 endif
 drawcandle(open,high,low,close) COLOURED(R,G,0) BORDERCOLOR(0,0,0)
else
 if oohline and not oohcandles then
  drawsegment(barindex,close,barindex-1,close[1]) COLOURED(0,0,0)
 else
  if oohcandles then
   drawcandle(open,high,low,close) COLOURED(R,G,0) BORDERCOLOR(0,0,0)
  endif
 endif
endif

return
Download
Filename:
Session-Candles-Only.itf
Downloads:
190
Download
Filename:
Screenshot_13-1.png
Downloads:
37
Master
V-oyaging ON A S-mall I-ncome
Author’s Profile
Loading...