

Seasonality Curve
This indicator can analyse any section of historical data day by day and produce a seasonality curve for it.
Set the starting date for the data to be analysed with the variable StartDate.
Set the end date for the data to be analysed with the variable EndDate.
Set either to zero if you don’t want a start or end date.
The highest and lowest points in the seasonality curve are highlighted. You can turn this off with the ‘HighAndLow’ setting.
You can also choose whether the calculations are done simply on price change or on the change as a percentage of price. The latter helps make a more direct comparison between older historical data and more recent data. Switch this on and off with the ‘Percentage’ setting.
The month labels indicate where a month starts.
The indicator only works on PRT v11 and must be applied to the daily chart only.
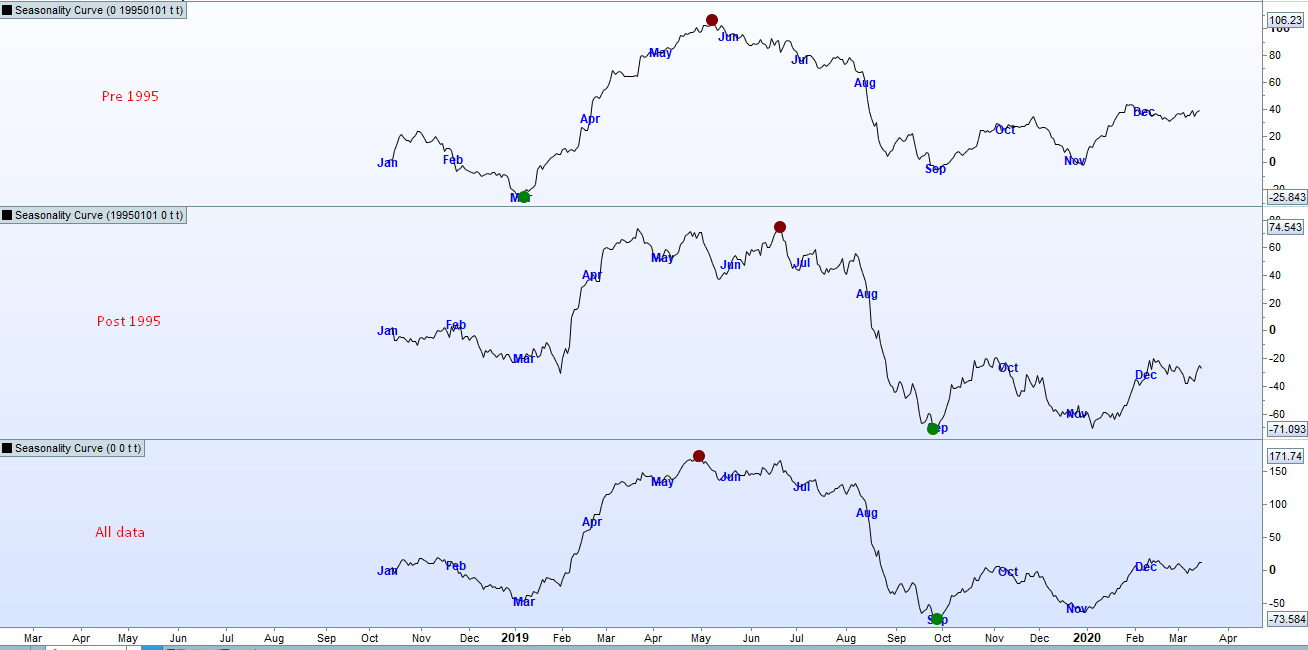
As it is possible to analyse different sections of history we can break our data into different samples and then directly compare them to see if there truly is seasonality. In the image there are three charts analysing Lean Hogs. The top one is analysing all the pre 1995 data back to the early 1960’s and the middle one all data from 1995 to the present day. the bottom one is analysing all the data for both periods. We can see that all the charts are pretty similar so it appears that lean hogs at least have some seasonality to them.
I advise importing the ITF file to get full functionality.
//Seasonality Curve
//By Vonasi
//Date: 20200326

defparam drawonlastbaronly = true

//StartDate = 19950101 //Set to zero to analyse all of history
//EndDate = 20200101 //Set to zero to analyse all of history
//HighAndLow = 1 //switch on and off drawing of high and low points
//Percentage = 1 //switch on or off calcualtion based on percentage of price

if enddate <= 0 or enddate < startdate then
enddate = 99999999
endif

if barindex > 0 and opendate >= startdate and opendate <= enddate then

if percentage then
diff = (((close - close[1])/close[1])*100)
else
diff = close - close[1]
endif

mydate = date - (floor(date/10000)*10000)
$total[mydate] = $total[mydate] + diff
endif

if islastbarupdate then

if barindex > 365 then
mymonth = 100
myday = 1
thisdate = mymonth + myday
lastsegment = 0
drawtext("Jan",barindex - 365,0,SansSerif,Bold,12)coloured(0,0,255)

a = 365
for b =  1 to 365
mybar = barindex - a
if isset($total[thisdate]) then
drawsegment(mybar,lastsegment,mybar+1,lastsegment + $total[thisdate])
lastsegment = lastsegment + $total[thisdate]
a = a - 1
endif

if myday = 31 then
mymonth = mymonth + 100
myday = 0

if mymonth = 200 then
drawtext("Feb",mybar,lastsegment - $total[thisdate],SansSerif,Bold,12)coloured(0,0,255)
endif
if mymonth = 300 then
drawtext("Mar",mybar,lastsegment - $total[thisdate],SansSerif,Bold,12)coloured(0,0,255)
endif
if mymonth = 400 then
drawtext("Apr",mybar,lastsegment - $total[thisdate],SansSerif,Bold,12)coloured(0,0,255)
endif
if mymonth = 500 then
drawtext("May",mybar,lastsegment - $total[thisdate],SansSerif,Bold,12)coloured(0,0,255)
endif
if mymonth = 600 then
drawtext("Jun",mybar,lastsegment - $total[thisdate],SansSerif,Bold,12)coloured(0,0,255)
endif
if mymonth = 700 then
drawtext("Jul",mybar,lastsegment - $total[thisdate],SansSerif,Bold,12)coloured(0,0,255)
endif
if mymonth = 800 then
drawtext("Aug",mybar,lastsegment - $total[thisdate],SansSerif,Bold,12)coloured(0,0,255)
endif
if mymonth = 900 then
drawtext("Sep",mybar,lastsegment - $total[thisdate],SansSerif,Bold,12)coloured(0,0,255)
endif
if mymonth = 1000 then
drawtext("Oct",mybar,lastsegment - $total[thisdate],SansSerif,Bold,12)coloured(0,0,255)
endif
if mymonth = 1100 then
drawtext("Nov",mybar,lastsegment - $total[thisdate],SansSerif,Bold,12)coloured(0,0,255)
endif
if mymonth = 1200 then
drawtext("Dec",mybar,lastsegment - $total[thisdate],SansSerif,Bold,12)coloured(0,0,255)
endif
endif

myday = myday + 1
thisdate = mymonth + myday

mymax = max(lastsegment,mymax)
once mymin = lastsegment
once mymax = lastsegment
mymin = min(lastsegment,mymin)
if mymax = lastsegment then
maxval = lastsegment
maxbar = mybar
endif
if mymin = lastsegment then
minval = lastsegment
minbar = mybar
endif
next
if HighAndLow then
drawpoint(maxbar+1,maxval,3)coloured(128,0,0)
drawpoint(minbar+1,minval,3)coloured(0,128,0)
endif
endif
endif

return mymax coloured(0,0,0,0), mymin coloured(0,0,0,0)