

Seasonality Analysis Graph
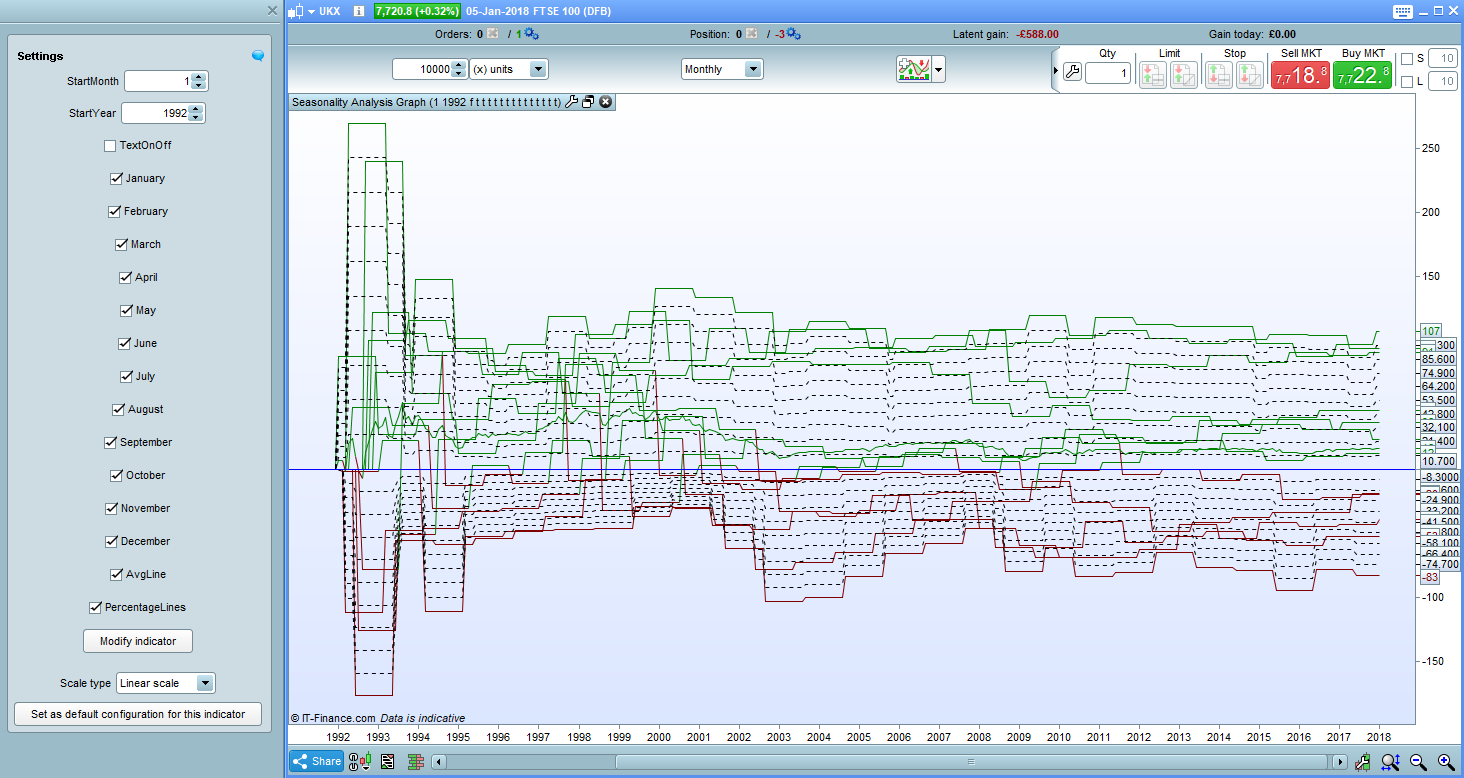
This indicator can be used alongside my other indicator ‘Seasonality Analysis’. This indicator creates a graph of the results of that indicator.
Being aware of seasonality is an important part of any traders toolbox so I wrote this indicator to help analyse any market month by month from any available date in the past to the present month.
Apply on any market but only on monthly charts.
You can select any start month and start year for the seasonality analysis. The graph is based on the average pips return in each month over the period tested. If you had opened a long bet at the beginning of each month and closed it at the end of each month every year then this is how much you would have gained or lost on average each month up to the date plotted on the graph.
You can turn on and off the text showing the return each month.
You can turn on and off each months chart line so as to analyse each month on its own or against other months.
You can turn on and off the average line. This is the average performance of all months as a comparison guide.
You can turn on and off percentage lines. The best performing month is rated at 100% and the worst at -100%. These lines help you see how each month ranks in performance compared to the best and worst.
//Seasonality Analysis Graph
//Created by Vonasi

//StartMonth = 1
//StartYear = 1997

IF OpenYear = StartYear and OpenMonth = StartMonth THEN
Flag = 1
ENDIF

IF Flag = 1 THEN
IF OpenMonth = 1 THEN
JanTotal = JanTotal + (close - open)
JanCount = JanCount + 1
ENDIF

IF OpenMonth = 2 THEN
FebTotal = FebTotal + (close - open)
FebCount = FebCount + 1
ENDIF

IF OpenMonth = 3 THEN
MarTotal = MarTotal + (close - open)
MarCount = MarCount + 1
ENDIF

IF OpenMonth = 4 THEN
AprTotal = AprTotal + (close - open)
AprCount = AprCount + 1
ENDIF

IF OpenMonth = 5 THEN
MayTotal = MayTotal + (close - open)
MayCount = MayCount + 1
ENDIF

IF OpenMonth = 6 THEN
JunTotal = JunTotal + (close - open)
JunCount = JunCount + 1
ENDIF

IF OpenMonth = 7 THEN
JulTotal = JulTotal + (close - open)
JulCount = JulCount + 1
ENDIF

IF OpenMonth = 8 THEN
AugTotal = AugTotal + (close - open)
AugCount = AugCount + 1
ENDIF

IF OpenMonth = 9 THEN
SepTotal = SepTotal + (close - open)
SepCount = SepCount + 1
ENDIF

IF OpenMonth = 10 THEN
OctTotal = OctTotal + (close - open)
OctCount = OctCount + 1
ENDIF

IF OpenMonth = 11 THEN
NovTotal = NovTotal + (close - open)
NovCount = NovCount + 1
ENDIF

IF OpenMonth = 12 THEN
DecTotal = DecTotal + (close - open)
DecCount = DecCount + 1
ENDIF
ENDIF

Jan = Round(JanTotal/JanCount)
Feb = Round(FebTotal/FebCount)
Mar = Round(MarTotal/MarCount)
Apr = Round(AprTotal/AprCount)
May1 = Round(MayTotal/MayCount)
Jun = Round(JunTotal/JunCount)
Jul = Round(JulTotal/JulCount)
Aug = Round(AugTotal/AugCount)
Sep = Round(SepTotal/SepCount)
Oct = Round(OctTotal/OctCount)
Nov = Round(NovTotal/NovCount)
Dec = Round(DecTotal/DecCount)

Avg = Round((Jan+ Feb + Mar + Apr + May1 + Jun + Jul + Aug + Sep + Oct + Nov + Dec)/12)

IF January THEN
IF Jan > 0 THEN
JanR = 0
JanG = 128
ELSE
JanR = 128
JanG = 0
ENDIF
IF TextOnOff THEN
DrawText("Jan #Jan#",barindex,Jan,SansSerif,Standard,12)coloured(JanR,JanG,0)
ENDIF
ELSE
Jan = 0
ENDIF

IF February THEN
IF Feb > 0 THEN
FebR = 0
FebG = 128
ELSE
FebR = 128
FebG = 0
ENDIF
IF TextOnOff THEN
DrawText("Feb #Feb#",barindex,Feb,SansSerif,Standard,12)coloured(FebR,FebG,0)
ENDIF
ELSE
Feb = 0
ENDIF

IF March THEN
IF Mar > 0 THEN
MarR = 0
MarG = 128
ELSE
MarR = 128
MarG = 0
ENDIF
IF TextOnOff THEN
DrawText("Mar #Mar#",barindex,Mar,SansSerif,Standard,12)coloured(MarR,MarG,0)
ENDIF
ELSE
Mar = 0
ENDIF

IF April THEN
IF Apr > 0 THEN
AprR = 0
AprG = 128
ELSE
AprR = 128
AprG = 0
ENDIF
IF TextOnOff THEN
DrawText("Apr #Apr#",barindex,Apr,SansSerif,Standard,12)coloured(AprR,AprG,0)
ENDIF
ELSE
Apr = 0
ENDIF

IF May THEN
IF May1 > 0 THEN
MayR = 0
MayG = 128
ELSE
MayR = 128
MayG = 0
ENDIF
IF TextOnOff THEN
DrawText("May #May1#",barindex,May1,SansSerif,Standard,12)coloured(MayR,MayG,0)
ENDIF
ELSE
May1 = 0
ENDIF

IF June THEN
IF Jun > 0 THEN
JunR = 0
JunG = 128
ELSE
JunR = 128
JunG = 0
ENDIF
IF TextOnOff THEN
DrawText("Jun #Jun#",barindex,Jun,SansSerif,Standard,12)coloured(JunR,JunG,0)
ENDIF
ELSE
Jun = 0
ENDIF

IF July THEN
IF Jul > 0 THEN
JulR = 0
JulG = 128
ELSE
JulR = 128
JulG = 0
ENDIF
IF TextOnOff THEN
DrawText("Jul #Jul#",barindex,Jul,SansSerif,Standard,12)coloured(JulR,JulG,0)
ENDIF
ELSE
Jul = 0
ENDIF

IF August THEN
IF Aug > 0 THEN
AugR = 0
AugG = 128
ELSE
AugR = 128
AugG = 0
ENDIF
IF TextOnOff THEN
DrawText("Aug #Aug#",barindex,Aug,SansSerif,Standard,12)coloured(AugR,AugG,0)
ENDIF
ELSE
Aug = 0
ENDIF

IF September THEN
IF Sep > 0 THEN
SepR = 0
SepG = 128
ELSE
SepR = 128
SepG = 0
ENDIF
IF TextOnOff THEN
DrawText("Sep #Sep#",barindex,Sep,SansSerif,Standard,12)coloured(SepR,SepG,0)
ENDIF
ELSE
Sep = 0
ENDIF

IF October THEN
IF Oct > 0 THEN
OctR = 0
OctG = 128
ELSE
OctR = 128
OctG = 0
ENDIF
IF TextOnOff THEN
DrawText("Oct #Oct#",barindex,Oct,SansSerif,Standard,12)coloured(OctR,OctG,0)
ENDIF
ELSE
Oct = 0
ENDIF

IF November THEN
IF Nov > 0 THEN
NovR = 0
NovG = 128
ELSE
NovR = 128
NovG = 0
ENDIF
IF TextOnOff THEN
DrawText("Nov #Nov#",barindex,Nov,SansSerif,Standard,12)coloured(NovR,NovG,0)
ENDIF
ELSE
Nov = 0
ENDIF

IF December THEN
IF Dec > 0 THEN
DecR = 0
DecG = 128
ELSE
DecR = 128
DecG = 0
ENDIF
IF TextOnOff THEN
DrawText("Dec #Dec#",barindex,Dec,SansSerif,Standard,12)coloured(DecR,DecG,0)
ENDIF
ELSE
Dec = 0
ENDIF

IF AvgLine THEN
IF Avg > 0 THEN
AvgR = 0
AvgG = 128
ELSE
AvgR = 128
AvgG = 0
ENDIF
IF TextOnOff THEN
DrawText("Avg #Avg#",barindex,Avg,SansSerif,Standard,12)coloured(AvgR,AvgG,0)
ENDIF
ELSE
Avg = 0
ENDIF

IF PercentageLines THEN
Bottom = Min(Dec,Min(Nov,Min(Oct,Min(Sep,Min(Aug,Min(Jul,Min(Jun,Min(May1,Min(Apr,Min(Mar,MIN(Feb,Jan)))))))))))
Top = Max(Dec,Max(Nov,Max(Oct,Max(Sep,Max(Aug,Max(Jul,Max(Jun,Max(May1,Max(Apr,Max(Mar,Max(Feb,Jan)))))))))))
UpNinety = Top * 0.9
UpEighty = Top * 0.8
UpSeventy = Top * 0.7
UpSixty = Top * 0.6
UpFifty = Top * 0.5
UpForty = Top * 0.4
UpThirty = Top * 0.3
UpTwenty = Top * 0.2
UpTen = Top * 0.1
DownTen = (Bottom * 0.1)
DownTwenty = (Bottom * 0.2)
DownThirty = (Bottom * 0.3)
DownForty = (Bottom * 0.4)
DownFifty = (Bottom * 0.5)
DownSixty = (Bottom * 0.6)
DownSeventy = (Bottom * 0.7)
DownEighty = (Bottom * 0.8)
DownNinety = (Bottom * 0.9)
ENDIF

DrawHLine(0) Coloured(0,0,255)

Return Jan coloured(JanR,JanG,0) as "Jan", Feb coloured(FebR,FebG,0) as "Feb", Mar coloured(MarR,MarG,0) as "Mar", Apr coloured(AprR,AprG,0) as "Apr", May1 coloured(MayR,MayG,0) as "May", Jun coloured(JunR,JunG,0) as "Jun", Jul coloured(JulR,JulG,0) as "Jul", Aug coloured(AugR,AugG,0) as "Aug", Sep coloured(SepR,SepG,0) as "Sep", Oct coloured(OctR,OctG,0) as "Oct", Nov coloured(NovR,NovG,0) as "Nov", Dec coloured(DecR,DecG,0) as "Dec", Avg coloured(AvgR,AvgG,0) as "AvgLinerage", UpTen as "10%", UpTwenty as "20%", UpThirty as "30%", UpForty as "40%", UpFifty as "50%", UpSixty as "60%", UpSeventy as "70%", UpEighty as "80%", UpNinety as "90%", DownTen as "-10%", DownTwenty as "-20%", DownThirty as "-30%", DownForty as "-40%", DownFifty as "-50%", DownSixty as "-60%", DownSeventy as "-70%", DownEighty as "-80%", DownNinety as "-90%"