

Scalpers Dot Board - Trading dashboard
July 27, 2017, 9:59 AM
Indicators
15 Comments
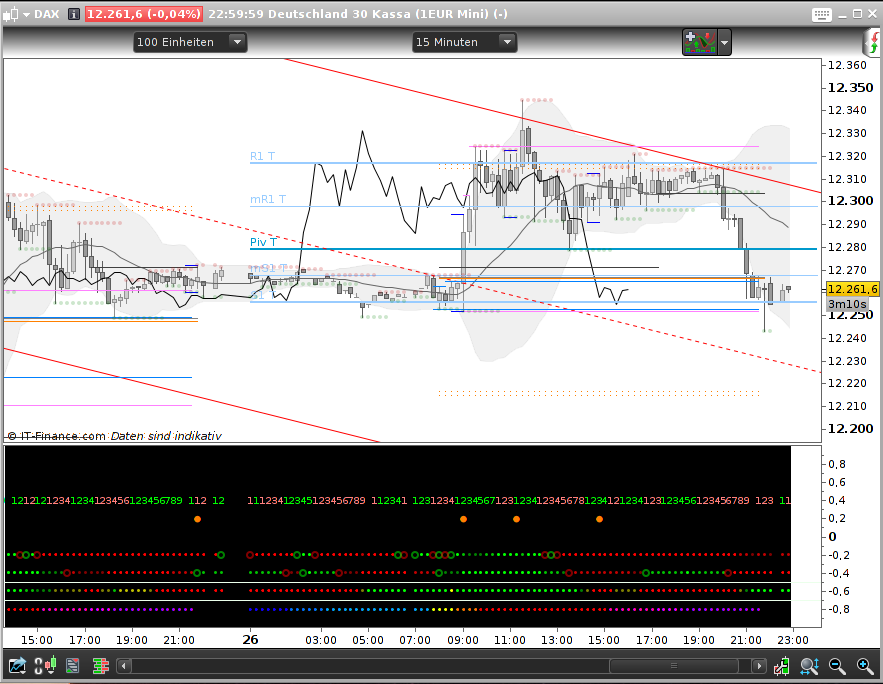
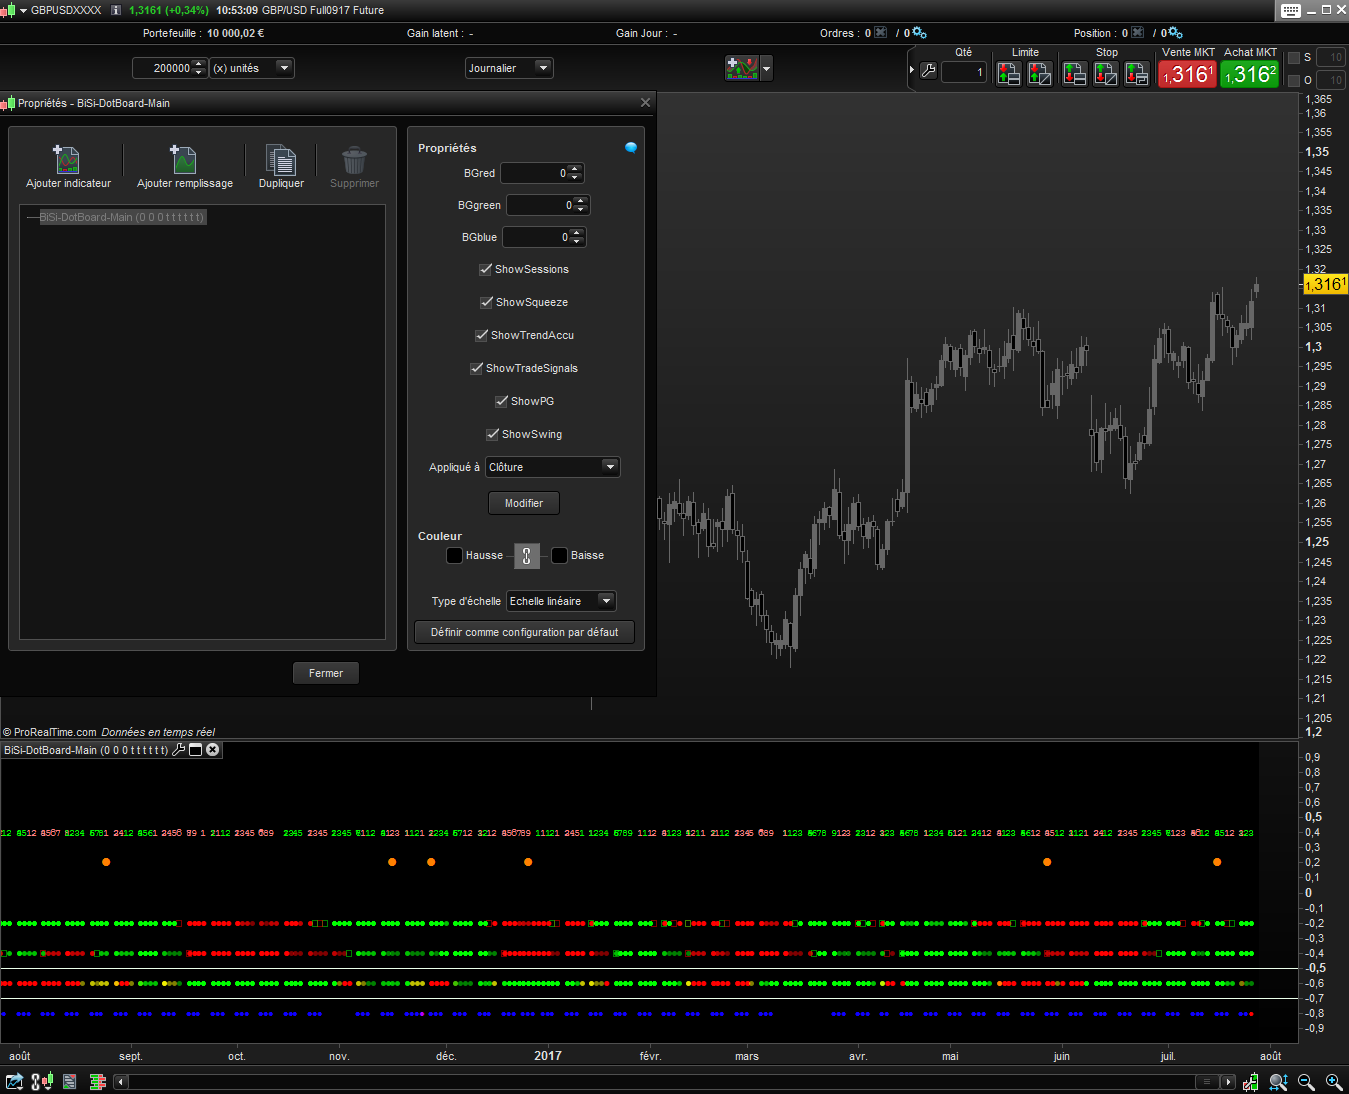
As I do not robot and my bar chart is already covered with all kind of lines – and additionally my screen size is limited – I needed a way to get rid of all those extra windows below the chart. So here is my Dot Board solution. It is modularized, so one can simply add another module line for own needs (well, I myself want some more).
On the picture you see how it is built up: we go from the most general information at the bottom up to the very special information for a single candle.
- market session times
- squeeze or not
- accumulated trend
- (one way of) trading signal
- (this line is still unused)
- PopGun and candle marker – well I don’t use much candles
- swing teller
Maybe you can make use of it and want to add your own module to it – or you just want a standalone module (that’s a version I use for testing before I integrate it into my Dot Board).
// === Scalpers Dot Board
// --- for PRT 10.3, July 2017, by AVT
// --- we use one section for each indicator module and its dot line
// --> for c&p Bullet • or Black Circle ●
//     square Bullet ▪  or Black Square ■  (halfwidth looks like 1st one)
//     heavy White Circle:   or medium bold White Circle:
//     these make a good combination: Bullet and heavy White Circle •
//     arrows:  ▲  ▼  ◄  ► (I would not use them, bad to see, color dot works better)
//     fade stepping: ([16, 32] [48, 64]) ([80, 96] [112, 128])
//                    ([144, 160] [176, 192]) ([208, 224] [240, 255])


// =========================== general section Begin ====================
// === Variables Begin
// --- extern variables begin
// ==> for users choice and quick turn on/off stuff make these extern
// ==> background color for the chart, NO Alpha (we need Alpha for fading)
//     BGred = 0    // type integer
//     BGgreen = 0
//     BGblue = 0
// ==> options to turn a line on/off all type boolean
//     this is the place where to add the ShowModule=1 for standalone tests
//ShowSessions=1        // IndiNo=0 the begin of the bottom, many colors, no separator needed
//ShowSqueeze=1         // IndiNo=1 bottom, above it a separator line
//ShowTrendAccu = 1     // IndiNo=2 1 line above
//ShowTradeSignals =1   // IndiNo=3 2 lines above
// atm unused         // IndiNo=4 3 lines above
//ShowPG = 1            // IndiNo=5 4 lines above
//ShowSwing=1           // IndiNo=6 5 lines above

// --- variables for painting
// ==> if you want these extern, type real
// --- low line offset, that's where the lowest line is
//     with each new indicator we go one line up
LowLineOffset = -0.8     // the y-axis position for the lowest line
// ---  add this number to IndiNo (starts with 0) to go one line up
IndiLineOffsetAdd = 0.2  // how much to add for the next upper line
// --- extern variables end

// --- intern
// --- check user background colors do not exeede allowed values
BGred=min(BGred,255)
BGred=max(BGred,0)
BGgreen=min(BGred,255)
BGgreen=max(BGred,0)
BGblue=min(BGred,255)
BGblue=max(BGred,0)
// --- a "dirty test" to draw a separator line either in black or in white
//     depending on the users choosen background
IF (BGred + BGgreen + BGblue) > 384 THEN
SepLineRed = 0
SepLineGreen = 0
SepLineBlue = 0
ELSE
SepLineRed = 235
SepLineGreen = 255
SepLineBlue = 235
ENDIF
// --- fading out the color from 255=bright to 0=invisible for painting dots
Fade0 = 255
Fade1 = 192
Fade2 = 128
Fade3= 64
//Fade4=0  // not used at the moment, uncomment if you need it
// === Variables End
// --- set background color for the window
BACKGROUNDCOLOR(BGred,BGgreen,BGblue)
// =========================== general section End ======================

// =========================== indicator section Begin ==================

// ============ Indicator 0 Begin
// === mark market session periods
// --- see also: @ Noobywan https://www.prorealcode.com/topic/market-session/#post-40397
// --- refs: https://en.wikipedia.org/wiki/List_of_stock_exchange_opening_times
//           https://en.wikipedia.org/wiki/List_of_stock_exchanges
IndiNo = 0

IF ShowSessions THEN
// --- no need to calculate the line offset for painting if it's not used
IndiLine = IndiLineOffsetAdd*IndiNo + LowLineOffset

// --- conditions
Session1 = (time>=080000 and time<090000 )   // 08:00-09:00 yellow EU pre
Session2 = (time>=090000 and time<100000 )   // 09:00-10:00 orange EU
Session3 = (time>=100000 and time<153000 )   // 10:00-15:30 red EU+GB
Session4 = (time>=153000 and time<173000 )   // 15:30-17:30 magenta EU+GB+US
Session5 = (time>=173000 and time<183000 )   // 17:30-18:30 darkmagenta GB+US
Session6 = (time>=183000 and time<220000 )   // 18:30-22:00 violet US
// --- note: this one paints overnight, so we need 22-00 and 00-2
// 22:00-02:00 darkblue ---- nothing, just to make it complete
Session7 = (time>=220000 and time<000000 ) OR (time>=000000 and time<020000 )
Session8 = (time>=020000 and time<033000 )   // 02:00-03:30 blue JP/AU
Session9 = (time>=033000 and time<080000 )   // 03:30-08:00 lightblue JP/AU+HK
// --- painting
// --- each if..endif on its own to make deleting easier
IF Session1 THEN
DRAWTEXT("•",barindex,IndiLine) coloured(255,255,0) // 08:00-09:00 yellow EU pre
ENDIF
IF Session2 THEN
Drawtext("•",barindex,IndiLine) coloured(255,112,0) // 09:00-10:00 orange EU
ENDIF
IF Session3 THEN
Drawtext("•",barindex,IndiLine) coloured(255,0,0)   // 10:00-15:30 red EU+GB
ENDIF
IF Session4 THEN
Drawtext("•",barindex,IndiLine) coloured(255,0,192) // 15:30-17:30 magenta EU+GB+US
ENDIF
IF Session5 THEN
Drawtext("•",barindex,IndiLine) coloured(240,0,255) // 17:30-18:30 darkmagenta GB+US
ENDIF
IF Session6 THEN
Drawtext("•",barindex,IndiLine) coloured(176,0,255) // 18:30-22:00 violet US
ENDIF
IF Session7 THEN
Drawtext("•",barindex,IndiLine) coloured(16,0,255)  // 22:00-02:00 darkblue ----
ENDIF
IF Session8 THEN
Drawtext("•",barindex,IndiLine) coloured(0,112,255) // 02:00-03:30 blue JP/AU
ENDIF
IF Session9 THEN
Drawtext("•",barindex,IndiLine) coloured(0,160,255) // 03:30-08:00 lightblue JP/AU+HK
ENDIF
// --- draw a separator line, delete if not wanted/needed
// --- explantion: at the end of IndiNo=1
DRAWHLINE(IndiLine+0.1) coloured(SepLineRed,SepLineGreen,SepLineBlue,Fade0)
ENDIF
// ============ Indicator 0 End

// ============ Indicator 1 Begin
// === Squeeze or not
// --- cedits: @ LazyBear https://www.tradingview.com/script/nqQ1DT5a-Squeeze-Momentum-Indicator-LazyBear/
//             @ ucsgear https://www.tradingview.com/script/0JQPULIU-UCS-Squeeze-Optimization/
//             @ Nicolas https://www.prorealcode.com/prorealtime-indicators/ttm-squeeze-oscillator-price-version/
// --- take the normal squeeze indicator and let a Haikin Ashi optimized confirm the squeeze
//     Haikin Ashi not so noisy, so as long as HA says "no" we do no full bright color
IndiNo = 1

IF ShowSqueeze THEN
// --- calculate the line offset for painting
IndiLine = IndiLineOffsetAdd*IndiNo + LowLineOffset

// --- test values in a standalone version, I found KC(16/1.4) quite good
BBlength=20
BBmult=2
KClength=16
KCmult=1.4
// --- calc and conditions
if barindex >1 then
HAClose = (open + high + low + close) /4
HAOpen = (HAOpen[1] + HAClose[1]) / 2
HAHigh = MAX( high,MAX(HAOpen,HAClose) )
HALow = MIN( low,MIN(HAOpen,HAClose) )
HAatr1 = abs(HAHigh - HAClose[1])
HAatr2 = abs(HAClose[1]  -HALow)
HAatr3 = abs(HAHigh - HALow)
HAatr = max(HAatr1, max(HAatr2,HAatr3) )
endif
// --- Bollinger Normal
NormalBBbasis = average[BBlength](close)
NormalBBdev = BBmult * Std[BBlength](close)
NormalupperBB = NormalBBbasis + NormalBBdev
NormallowerBB = NormalBBbasis - NormalBBdev
// --- Bollinger HAoptimized
OptiBBbasis = average[BBlength](HAclose)
OptiBBdev = BBmult * Std[BBlength](HAclose)
OptiupperBB = OptiBBbasis + OptiBBdev
OptilowerBB = OptiBBbasis - OptiBBdev
// --- Keltner Channel normal
NormalKCma = average[KClength](close)
NormalKCrangema = average[KClength](AverageTrueRange[KClength])
NormalupperKC = NormalKCma + NormalKCrangema * KCmult
NormallowerKC = NormalKCma - NormalKCrangema * KCmult
// --- Keltner Channel HAoptimized
OptiKCma = average[KClength](HAclose)
OptiKCrangema = average[KClength](HAatr[KClength])
OptiupperKC = OptiKCma + OptiKCrangema * KCmult
OptilowerKC = OptiKCma - OptiKCrangema * KCmult

// --- Squeeze on or off normal
NormalsqzOn = (NormallowerBB > NormallowerKC) AND (NormalupperBB < NormalupperKC)
NormalsqzOff = (NormallowerBB < NormallowerKC) AND (NormalupperBB > NormalupperKC)
NormalnoSqz = (NOT NormalsqzOn) AND (NOT NormalsqzOff)
// --- Squeeze on or off HAoptimized
OptisqzOn = (OptilowerBB > OptilowerKC) AND (OptiupperBB < OptiupperKC)
OptisqzOff = (OptilowerBB < OptilowerKC) AND (OptiupperBB > OptiupperKC)
OptinoSqz = (NOT OptisqzOn) AND (NOT OptisqzOff)

// --- painting
if NormalsqzOn then   // having a squeeze means wait with trendfollow, rangescalp =red
FadeState=Fade0          // normal says "squeeze", bright red
if OptinoSqz then        // HA says "no", go one step darker
FadeState=Fade1
elsif OptisqzOff then    // HA says "squeeze? that thing is released!", one darker
FadeState=Fade2
endif
DRAWTEXT("•",barindex,IndiLine,monospaced,standard,11) coloured(255,0,0,FadeState)
endif
if NormalsqzOff then // squeeze is released, so action trendfollow allowed =green
FadeState=Fade0         // normal says "released, follow trend", bright green
if OptinoSqz then       // HA says "wait with your release", one step darker green
FadeState=Fade1
elsif OptisqzOn then    // HA says "error, full squeeze", another step darker
FadeState=Fade2
endif
DRAWTEXT("•",barindex,IndiLine,monospaced,standard,11) coloured(0,255,0,FadeState)
endif
// --- normal calculation: this is an addition in LazyBear and ucsgear version
if NormalnoSqz then     // no Squeeze, yellow
FadeState=Fade1
if OptisqzOff then   // HA has released go lighter
FadeState=Fade0
elsif OptisqzOn then // HA has squeezed, go darker
FadeState=Fade2
endif
DRAWTEXT("•",barindex,IndiLine,monospaced,standard,11) coloured(255,255,0,FadeState)
endif
// --- to separate the squeeze indicator from all the others, draw a separator line
//     we do this because we use the same colors as those for trend and acting signals
//     and we do NOT want this line to be mistaken as a trend line
// ==> note: we use fontsize=11 and a line stepping of 0.2,
//     therefore we put the separator line into the middle, thats line + 0.1
DRAWHLINE(IndiLine+0.1) coloured(SepLineRed,SepLineGreen,SepLineBlue,Fade0)
ENDIF
// ============ Indicator 1 End


// ============ Indicator 2 Begin
// === Trenddetection accumulated SMA, default MACD and default SAR
// --- credits: @ Ciccio https://www.prorealcode.com/prorealtime-indicators/candlesticks-patterns-indicator/
// ==> Candle signals depend on trend, IF Show__ just limits painting, not calculation
//     that's just in case you want the candle signals as indicator later
IndiNo = 2

// --- calc and conditions
maFastPeriod = 7
maSlowPeriod = 21
maFast = average[maFastPeriod,0](close)
maSlow = average[maSlowPeriod,0](close)
// --- 1. 2 EMA values
MAup = ( maFast>=maSlow )
MAdown = ( maFast<maSlow )
// --- 2. default value MACD
MACDup = ( MACDline[12,26,9](close)>0 AND MACD[12,26,9](close)>0 )
MACDdown = ( MACDline[12,26,9](close)<0 AND MACD[12,26,9](close)<0 )
// --- 3. default value Parabolic SAR
SARup = ( SAR[0.02,0.02,0.2]<low )
SARdown = ( SAR[0.02,0.02,0.2]>high )

// --- conditions: we have 5 trend states
IF maFast CROSSES OVER maSlow THEN      // cross up, uptrend might begin, slight green
TRENDstate = 1
ELSIF MAup THEN                         // fast above, uptrend, bright green
TRENDstate = 2
ELSIF maFast CROSSES UNDER maSlow THEN  // cross down, downtrend might begin, slight red
TRENDstate = -1
ELSIF MAdown THEN                       // fast below, downtrend, bright red
TRENDstate = -2
ELSE
TRENDstate = 0                          // forgot something or not enough data to calc
ENDIF

// ==> this is the IF Show___ which is usually at the beginning
IF ShowTrendAccu THEN
// --- in which line to paint our dots
IndiLine = IndiLineOffsetAdd*IndiNo + LowLineOffset

// --- intensity of trend depending on how many of the indicators say Trend is up/down
//     we start with Fade2 and for each one confirming we go one step brighter
// !!! default MA is the first one to cry TREND!
IF MAup THEN                // first on, think we have a trend => bit green
FadeState = Fade2
IF SARup THEN            // you are right => bit more green
FadeState = Fade1
IF MACDup THEN        // got it too, let's go => bright green
FadeState = Fade0
ENDIF
ENDIF
ENDIF
IF MAdown THEN              // same play here
FadeState = Fade2
IF SARdown THEN
FadeState = Fade1
IF MACDdown THEN
FadeState = Fade0
ENDIF
ENDIF
ENDIF

IF TRENDstate = 2 THEN      // fast above slow, strong up: bright green
DRAWTEXT("•",barindex,IndiLine,monospaced,standard,11) coloured(0,255,0,FadeState)
ELSIF TRENDstate = 1 THEN   // fast crossing up, begins up: fade green
DRAWTEXT("",barindex,IndiLine,monospaced,standard,11) coloured(0,255,0,Fade2)
ELSIF TRENDstate = -1 THEN  // fast crossing down, begins down: fade red
DRAWTEXT("",barindex,IndiLine,monospaced,standard,11) coloured(255,0,0,Fade2)
ELSIF TRENDstate = -2 THEN  // fast below slow, strong down: bright red
DRAWTEXT("•",barindex,IndiLine,monospaced,standard,11) coloured(255,0,0,FadeState)
ENDIF
ENDIF
// ============ Indicator 2 End

// ============ Indicator 3
// === Tradingsignals OBOS+STOCH+RSI, enter STOCHcross if RSI agrees, exit Price crosses TEMA
// --- sma(50 is quite good for trendtrading too)
IndiNo = 3
IF ShowTradeSignals THEN
// --- the line in which to paint our dots
IndiLine = IndiLineOffsetAdd*IndiNo + LowLineOffset

// --- calc and conditions
// --- trade enter indicator, this is also our trendline indicator
temaPeriod = 50 // 21
temaVal = tema[temaPeriod](close)
// tema trend for painting the main line
temaUp = ( close[0] > temaVal )
temaDown = ( close[0] < temaVal )
// tema signals for short or long
temaEnterLong = ( close[0] CROSSES OVER temaVal )
temaEnterShort = ( close[0] CROSSES UNDER temaVal )

// --- trade exit indicator
rsiPeriod = 10  // is for German DAX in m5 a typical Limit
rsiVal = rsi[rsiPeriod](close)
//rsiUp = ( rsiVal > rsiVal[1] )
rsiDefaultUpper = 70
rsiDefaultLower = 30
RSIupperBorder1 = 80
RSIupperBorder2 = 90
RSIlowerBorder1 = 20
RSIlowerBorder2 = 10
//rsiDownCross = ( rsiVal CROSSES UNDER rsiDefaultUpper )
//rsiUpCross = ( rsiVal CROSSES OVER rsiDefaultLower )
rsiExitLong = ( rsiVal CROSSES UNDER rsiDefaultUpper )
//rsiExitShort = ( rsiVal CROSSES OVER rsiDefaultLower )

// rsi overbought, oversold for painting the fades into the main line
rsiOB1 = ( rsiVal >= rsiDefaultUpper AND rsiVal < RSIupperBorder1 ) // begin overbought
rsiOB2 = ( rsiVal >= RSIupperBorder1 AND rsiVal < RSIupperBorder2 ) // exeede overbought
rsiOB3 = ( rsiVal >= RSIupperBorder2 )                              // extrem overbought
rsiOS1 = ( rsiVal <= rsiDefaultLower AND rsiVal > RSIlowerBorder1 )
rsiOS2 = ( rsiVal <= RSIlowerBorder1 AND rsiVal > RSIlowerBorder2 )
rsiOS3 = ( rsiVal <= RSIlowerBorder2 )

// --- painting the color line

LongTradeStart = temaEnterLong                                   // state=3
LongTradeKeep = temaUp                                           // state=2
LongTradeExit = ( (temaUp AND rsiExitLong) OR temaEnterShort )   // state=1
//TradeWait = ( temaDown AND rsiVal  )  // state=0
ShortTradeStart = temaEnterShort
ShortTradeKeep = temaDown
//ShortTradeExit = ( (temaDown AND rsiExitShort) OR temaEnterLong )

// --- we know 3 states: longstart, longend=shortstart, shortstart, (shortend=longstart)
IF LongTradeStart THEN                  // exit short + enter long
TRENDstate = 2
FadeState = Fade2
ELSIF LongTradeKeep THEN                // stay long
TRENDstate = 1
FadeState = Fade0                    // tema + rsi up, complete green
IF rsiOB1 THEN
FadeState = Fade1                 // rsi says overbought, careful, take one green off
ELSIF rsiOB2 THEN
FadeState = Fade2                 // rsi more overbought, may now change, another green off
ELSIF rsiOB3 THEN
FadeState = Fade3                 // rsi extreme overbought, forget long, another green off
ENDIF
ELSIF LongTradeExit AND ShortTradeStart THEN  // exit long + enter short
TRENDstate = -1
FadeState = Fade2
ELSIF ShortTradeKeep THEN                    // stay short
TRENDstate = -2
FadeState = Fade0                         // tema + rsi down, complete red
IF rsiOS1 THEN
FadeState = Fade1                      // rsi says oversold, careful, take one red off
ELSIF rsiOS2 THEN
FadeState = Fade2                      // rsi more oversold, may now change, another red off
ELSIF rsiOS3 THEN
FadeState = Fade3                      // rsi extreme oversold, forget short, another red off
ENDIF
ELSE          // no action allowed
TRENDstate = 0
ENDIF
// --- painting
IF TRENDstate = 2 THEN      // enter long, green
DRAWTEXT("",barindex,IndiLine,monospaced,standard,11) coloured(0,255,0,FadeState)
ELSIF TRENDstate = 1 THEN   // stay long, green
DRAWTEXT("•",barindex,IndiLine,monospaced,standard,11) coloured(0,255,0,FadeState)
ELSIF TRENDstate = -1 THEN   // exit long + enter short, red
DRAWTEXT("",barindex,IndiLine,monospaced,standard,11) coloured(255,0,0,FadeState)
ELSIF TRENDstate = -2 THEN  // stay short, red
DRAWTEXT("•",barindex,IndiLine,monospaced,standard,11) coloured(255,0,0,FadeState)
ELSE                        // =0 wait
DRAWTEXT("•",barindex,IndiLine,monospaced,standard,11) coloured(255,128,0,FadeState)
ENDIF
ENDIF
// ============ Indicator 3 End

// ============ Indicator 4 Begin
// ============ Indicator 4 End

// ============ Indicator 5 Begin
// === Popgun Marker and Candles
// !!! important for candles: leave the calculation of IndiNo = 2 in
//     candles depend on trend
IndiNo = 5

IF ShowPG THEN
// --- the line in which to paint our dots
IndiLine = IndiLineOffsetAdd*IndiNo + LowLineOffset

// --- calc for candles, some outcommented cause my candles don't need them
body=close-open
abody=abs(body)
if range>0 then
ratio=abody/range
else
ratio=0
endif
middle=(open+close)/2
// ==> outcomment the following if you add more candle patterns and they need them
//bodytop=max(open, close)
//bodybottom=min(open, close)
//shadowtop=high-bodytop
//shadowbottom=bodybottom-low
longcandle= (ratio>0.6)

// --- conditions
Popgun=(high[0]>high[1] AND low[0]<low[1] AND high[1]<high[2] AND low[1]>low[2])
// --- only want PGs painted from timeframe m15 and higher and only within 8-22
// --- only PGs from m15 upward are tradable
IF (time>=080000 AND time<=220000) THEN
// --- get times of the last 4 candles, get difference between 2 candles
// --- we must compare because once in an hour due to maths the result is wrong
Result0=time[0]-time[1]
Result1=time[1]-time[2]
Result2=time[2]-time[3]
// --- if 2 results are identical, that's the right one
IF Result0=Result1 OR Result0=Result2 THEN  // 2 identical results
IF Result0>0 AND Result0<1500 THEN       // m30=0 m15=1500
PGforbidden=1                         // less than m15, greater m30=0
ENDIF
ELSIF Result1=Result2 THEN                  // 2 identical results, do same as above
IF Result0>0 AND Result0<1500 THEN       // m30=0 m15=1500
PGforbidden=1                         // less than m15, greater m30=0
ENDIF
ENDIF
ENDIF

// --- candle detection:
// --- BullishThreeLineStrike in bullmarket after downreversal
Bull3LineStrike=(body[3]>0 and body[2]>0 and body[1]>0 and body<0 and longcandle[3] and longcandle[2] and longcandle[1] and close[2]>close[3] and close[1]>close[2] and open>close[1] and close<open[3])
// --- ThreeBlackCrows in bearmarket after up breakout
ThreeBlackCrows=(body[2]<0 and body[1]<0 and body<0 and longcandle[2] and longcandle[1] and longcandle and low[1]<low[2] and low<low[1] and close[1]<close[2] and close<close[1] and open[1]<open[2] and open[1]>close[2] and open<open[1] and open>close[1])
// --- EveningStar in downtrend after upreversal
EveStar=(body[2]>0 AND body<0 and longcandle[2] and open[1]>close[2] and open<close[1] and ratio[1]<0.3 and abody[1]<abody[2] and abody[1]<abody and high[1]>high and high[1]>high[2] and low[1]>open[2] and low[1]>close)
// --- special PiercingLine in down RETRACEMENT (only retracement)
PierceLine=(body[1]<0 and body>0 and longcandle[1] and longcandle and open<low[1] and close>middle[1] and close<open[1])

// --- painting
IF TrendState = 2 AND Bull3LineStrike THEN
DRAWTEXT("●",barindex,IndiLine,monospaced,standard,11) coloured(0,255,0,Fade0) // green
ELSIF TrendState = 2 AND ThreeBlackCrows THEN
DRAWTEXT("●",barindex,IndiLine,monospaced,standard,11) coloured(255,0,0,Fade0) // red
ELSIF TrendState = 2 AND EveStar THEN
DRAWTEXT("●",barindex,IndiLine,monospaced,standard,11) coloured(255,0,0,Fade0) // red
ELSIF TrendState = -1 AND PierceLine THEN
DRAWTEXT("●",barindex,IndiLine,monospaced,standard,11) coloured(0,255,0,Fade0) // green
ENDIF
// --- popgun last, that's the most important for me
// ==> if candles are more important for you, put this before the candle painting
IF Popgun AND (NOT PGforbidden) THEN
DRAWTEXT("●",barindex,IndiLine,monospaced,standard,11) coloured(255,128,0,Fade0) // orange, no direction
ENDIF
ENDIF
// ============ Indicator 5 End


// this one should be the top one because it is the most special
// =========================== indicator section Begin ==================
// ============ Indicator 6 Begin
// === PRC_swing teller live count2
// --- credits: @ Nicolas https://www.prorealcode.com/topic/rewrite-code-to-prorealtime-code/
// --- note: we use the smallest font size in case fails should be shown
IndiNo=6

IF ShowSwing THEN
ShowFails=0  // =1 yes -> we need 2 lines, =0 no -> we need one line
// --- variables for painting
IndiLine = IndiLineOffsetAdd*IndiNo + LowLineOffset
// --- if we want to see the counting fail marks, we need 2 lines
//     because fail marker and new counter have the same bar position
IF ShowFails THEN
IndiUp=IndiLine+0.05    // put the ups in upper line part
IndiDown=IndiLine-0.05  // put the down in lower line part
ELSE
IndiUp=IndiLine         // up counter numbers in one line
IndiDown=IndiLine       // down counter numbers in same line
ENDIF
// --- to make changes in color easier we set variables for the colors
//     this way we don't have to change all painting lines
// --- naming: [R(ed)|G(reen)|B(lue)][u(p)|d(own)][c(ounting)|f(ailed)]
// --- up counting and fails
Ruc=0    // counter
Guc=255  // counter
Buc=0    // counter
Ruf=0    // fail
Guf=128  // fail
Buf=0    // fail
// --- down counting and fails
Rdc=255  // counter
Gdc=128  // counter
Bdc=128  // counter
Rdf=255  // fail
Gdf=0    // fail
Bdf=0    // fail

// --- calc and painting
Lb=4
// --- up swing
if UpCount>0 and Close>Close[Lb] then
DownCount=0
UpCount=UpCount+1
// --- paintig the up counts following No. 1
if UpCount=2 then
DRAWTEXT("2",barindex,IndiUp,Monospaced,Standard,10) coloured(Ruc,Guc,Buc)
elsif UpCount=3 then
DRAWTEXT("3",barindex,IndiUp,Monospaced,Standard,10) coloured(Ruc,Guc,Buc)
elsif UpCount=4 then
DRAWTEXT("4",barindex,IndiUp,Monospaced,Standard,10) coloured(Ruc,Guc,Buc)
elsif UpCount=5 then
DRAWTEXT("5",barindex,IndiUp,Monospaced,Standard,10) coloured(Ruc,Guc,Buc)
elsif UpCount=6 then
DRAWTEXT("6",barindex,IndiUp,Monospaced,Standard,10) coloured(Ruc,Guc,Buc)
elsif UpCount=7 then
DRAWTEXT("7",barindex,IndiUp,Monospaced,Standard,10) coloured(Ruc,Guc,Buc)
elsif UpCount=8 then
DRAWTEXT("8",barindex,IndiUp,Monospaced,Standard,10) coloured(Ruc,Guc,Buc)
elsif UpCount=9 then
DRAWTEXT("9",barindex,IndiUp,Monospaced,Standard,10) coloured(Ruc,Guc,Buc)
last9bar=barindex
// reset count
UpCount=0
endif
// up swing fail
elsif UpCount>0 and Close<Close[Lb] then
// --- we have enough space, so we can show the fails
if ShowFails then
// --- mark if an up swing failed
DRAWTEXT("F",barindex,IndiUp,Monospaced,Standard,10) coloured(Ruf,Guf,Buf)
endif
// reset count
UpCount=0
endif

// --- down swing
if DownCount>0 and Close<Close[Lb] then
UpCount=0
DownCount=DownCount+1
// --- paint the down counts folling No. 1
if DownCount=2 then
DRAWTEXT("2",barindex,IndiDown,Monospaced,Standard,10) coloured(Rdc,Gdc,Bdc)
elsif DownCount=3 then
DRAWTEXT("3",barindex,IndiDown,Monospaced,Standard,10) coloured(Rdc,Gdc,Bdc)
elsif DownCount=4 then
DRAWTEXT("4",barindex,IndiDown,Monospaced,Standard,10) coloured(Rdc,Gdc,Bdc)
elsif DownCount=5 then
DRAWTEXT("5",barindex,IndiDown,Monospaced,Standard,10) coloured(Rdc,Gdc,Bdc)
elsif DownCount=6 then
DRAWTEXT("6",barindex,IndiDown,Dialog,Standard,10) coloured(Rdc,Gdc,Bdc)
elsif DownCount=7 then
DRAWTEXT("7",barindex,IndiDown,Monospaced,Standard,10) coloured(Rdc,Gdc,Bdc)
elsif DownCount=8 then
DRAWTEXT("8",barindex,IndiDown,Monospaced,Standard,10) coloured(Rdc,Gdc,Bdc)
elsif DownCount=9 then
DRAWTEXT("9",barindex,IndiDown,Monospaced,Standard,10) coloured(Rdc,Gdc,Bdc)
last9bar=barindex
// reset count
DownCount=0
endif
// down swing fail
elsif DownCount>0 and Close>Close[Lb] then
// --- we have enough space, so we can show the fails
if ShowFails then
// --- mark a failed down swing
DRAWTEXT("F",barindex,IndiDown,Monospaced,Standard,10) coloured(Rdf,Gdf,Bdf)
endif
// reset count
DownCount=0
endif

// --- begin swing Up
if UpCount=0 and barindex-last9bar>1 then
r = close[Lb]
if close>r then
UpCount=1
DownCount=0
// draw up counter No. 1
DRAWTEXT("1",barindex,IndiUp,Monospaced,Standard,10) coloured(Ruc,Guc,Buc)
endif
endif

// --- begin swing Down
if DownCount=0 and barindex-last9bar>1 then
r = close[Lb]
if close<r then
DownCount=1
UpCount=0
// draw down counter No. 1
DRAWTEXT("1",barindex,IndiDown,Monospaced,Standard,10) coloured(Rdc,Gdc,Bdc)
endif
endif
ENDIF
// ============ Indicator 6 End


// template
// ============ Indicator x Begin
//IndiNo = x
//IF Show____ THEN
// --- in which line to paint our dots
//IndiLine = IndiLineOffsetAdd*IndiNo + LowLineOffset

// --- calc and conditions

// --- painting
//ENDIF
// ============ Indicator x End

// =========================== indicator section End ====================

// =========================== End marker, nothing below this line ======
RETURN
// === Program End
Download
Filename:
dot-board-indicator-prorealtime.png
Downloads:
366
Download
Filename:
BiSi-DotBoard-Main-1.itf
Downloads:
648
Senior
Code artist, my biography is a blank page waiting to be scripted. Imagine a bio so awesome it hasn't been coded yet.
Author’s Profile
Loading...