

RSI Supertrend: A Trend and Momentum Indicator
1. Introduction
The Relative Strength Index (RSI) is a highly popular technical indicator that measures the magnitude of recent price changes to evaluate overbought or oversold conditions in a market. On the other hand, the Supertrend is a trend indicator that uses the Average True Range (ATR) to determine the direction of the trend and provide buy or sell signals.
The ‘RSI Supertrend’ combines these two powerful indicators into one, offering a robust tool for identifying trends and reversal points in the market.
2. Indicator Functionality
RSI Calculation
The RSI is calculated using the following formula:
RSI = 100 – 100 / (1 + RS)
Where RS is the average of gains in bullish periods divided by the average of losses in bearish periods. In this case, we use a 14-period RSI:
myrsi = rsi[relativeStrengthIndexLength](rsiInputSource)The calculated RSI is smoothed using a 14-period moving average:
rsiMovingAverage = average[movingAverageLength, movingAverageType](myrsi)Supertrend Calculation Based on RSI
The Supertrend is calculated using the ATR to determine market volatility. The process includes the following steps:
1. True Range (TR) Calculation:
highestHigh = highest[averageTrueRangeLength](pricesource)
lowestlow = lowest[averageTrueRangeLength](pricesource)
2. Average True Range (ATR) Calculation:
atr = average[averageTrueRangeLength](truerange)3. Determination of Supertrend Levels (UP and DN):
up = pricesource - trendFactor * atr
dn = pricesource + trendFactor * atr
4. Determination of the Trend:
if trend = 1 then
    mysupertrend = up
else
    mysupertrend = dn
endif
3. Configuring the Indicator in ProRealTime
The ‘RSI Supertrend’ can be customized using various configurable parameters:
– relativeStrengthIndexLength: RSI period length (default, 14).
– rsiInputSource: Data source for RSI calculation.
– movingAverageLength: Length of the moving average used to smooth the RSI.
– movingAverageType: Type of moving average (7 represents a simple moving average).
– trendFactor: Trend factor used to calculate Supertrend levels.
– averageTrueRangeLength: Period length for ATR calculation.
– obline, osline, midline: Overbought, oversold, and middle lines.
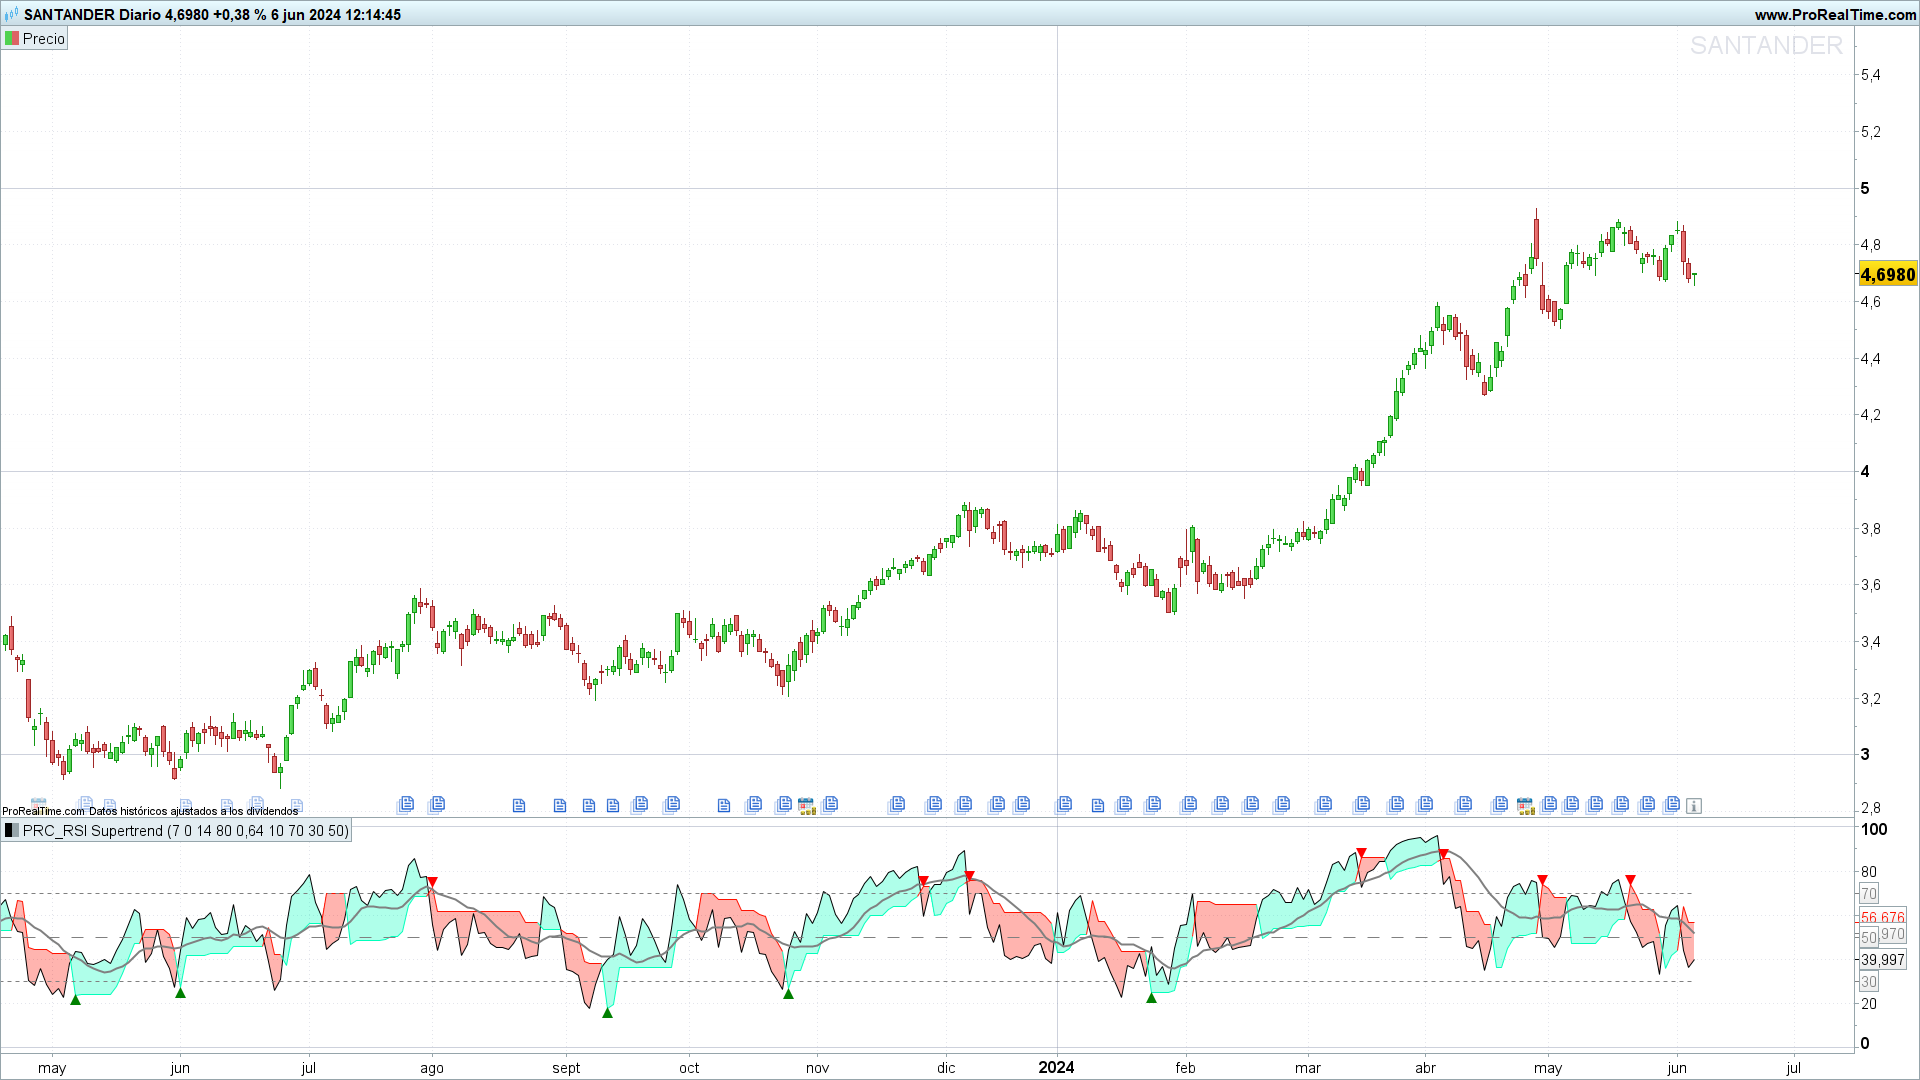
4. Practical Application
The ‘RSI Supertrend’ provides clear visual signals for buy and sell operations:
– Buy Signal: When the RSI crosses the Supertrend upwards and the RSI is greater than the overbought line (obline).
– Sell Signal: When the RSI crosses the Supertrend downwards and the RSI is less than the oversold line (osline).
These crosses indicate possible trend reversal points, offering opportunities to enter and exit the market.
Advantages:
– Combines the strength of the RSI and Supertrend.
– Provides buy and sell signals based on trend and momentum.
Limitations:
– May generate false signals in sideways markets.
– Requires parameter adjustments for different assets and market conditions.
5. ProRealTime Indicator Code
//--------------------------------------------------------------------//
//PRC_RSI Supertrend
//version = 1
//03.06.24
//Iván González @ www.prorealcode.com
//Sharing ProRealTime knowledge
//--------------------------------------------------------------------//
//-----Inputs---------------------------------------------------------//
relativeStrengthIndexLength=14
rsiInputSource = customclose

movingAverageLength=14
movingAverageType=7

trendFactor=0.8
averageTrueRangeLength=10

obline=70
osline=30
midline=50
transparency=80
//--------------------------------------------------------------------//
//-----RSI Calculation------------------------------------------------//
myrsi=rsi[relativeStrengthIndexLength](rsiInputSource)
rsiMovingAverage=average[movingAverageLength,movingAverageType](myrsi)
//--------------------------------------------------------------------//
//-----Calculating Supertrend based on RSI values---------------------//
pricesource=myrsi

highestHigh=highest[averageTrueRangeLength](pricesource)
lowestlow=lowest[averageTrueRangeLength](pricesource)

if barindex <= averageTrueRangeLength then
truerange=highestHigh-lowestlow
else
truerange=max(highestHigh-lowestlow,max(abs(highestHigh-pricesource[1]),abs(lowestlow-pricesource[1])))
endif

alpha = 1/averageTrueRangeLength

if barindex <= 4*averageTrueRangeLength then
atr = average[averageTrueRangeLength](truerange)
else
atr = alpha*truerange + (1-alpha)*atr[1]
endif

up = pricesource - trendFactor*atr

up1 = up[1]
if pricesource[1] > up1 then
up = max(up,up1)
else
up = up
endif

dn = pricesource + trendFactor*atr
dn1 = dn[1]
if pricesource[1] < dn1 then
dn = min(dn,dn1)
else
dn = dn
endif

once trend = 1

if trend = -1 and pricesource > dn1 then
trend = 1
elsif trend = 1 and pricesource < up1 then
trend = -1
else
trend = trend
endif

if trend = 1 then
mysupertrend = up
else
mysupertrend = dn
endif
//--------------------------------------------------------------------//
if trend=1 then
r=0
g=255
b=187
else
r=255
g=17
b=0
endif
//--------------------------------------------------------------------//
colorbetween(mysupertrend,pricesource,r,g,b,transparency)
//--------------------------------------------------------------------//
if mysupertrend crosses over pricesource and mysupertrend>Obline then
drawtext("▼",barindex,mysupertrend+2)coloured("red")
elsif mysupertrend crosses under pricesource and mysupertrend<osline then
drawtext("▲",barindex,mysupertrend-2)coloured("green")
endif
//--------------------------------------------------------------------//
return pricesource as "RSI",mysupertrend as "Supertrend"coloured(r,g,b),rsiMovingAverage as "MA RSI" coloured("grey")style(line,2),obline as "Overbought Line" coloured("grey")style(dottedline),osline as "Overbought Line" coloured("grey")style(dottedline),midline as "Middle Line" coloured("grey")style(dottedline2)
6. Conclusion
The ‘RSI Supertrend’ is a valuable tool for traders looking to identify trends and reversal points in the market. By combining the RSI with the Supertrend, a more comprehensive view of market momentum and direction is obtained, which can help make more informed trading decisions.
