

RSI Supertrend
June 13, 2019, 7:55 AM
Indicators
2 Comments
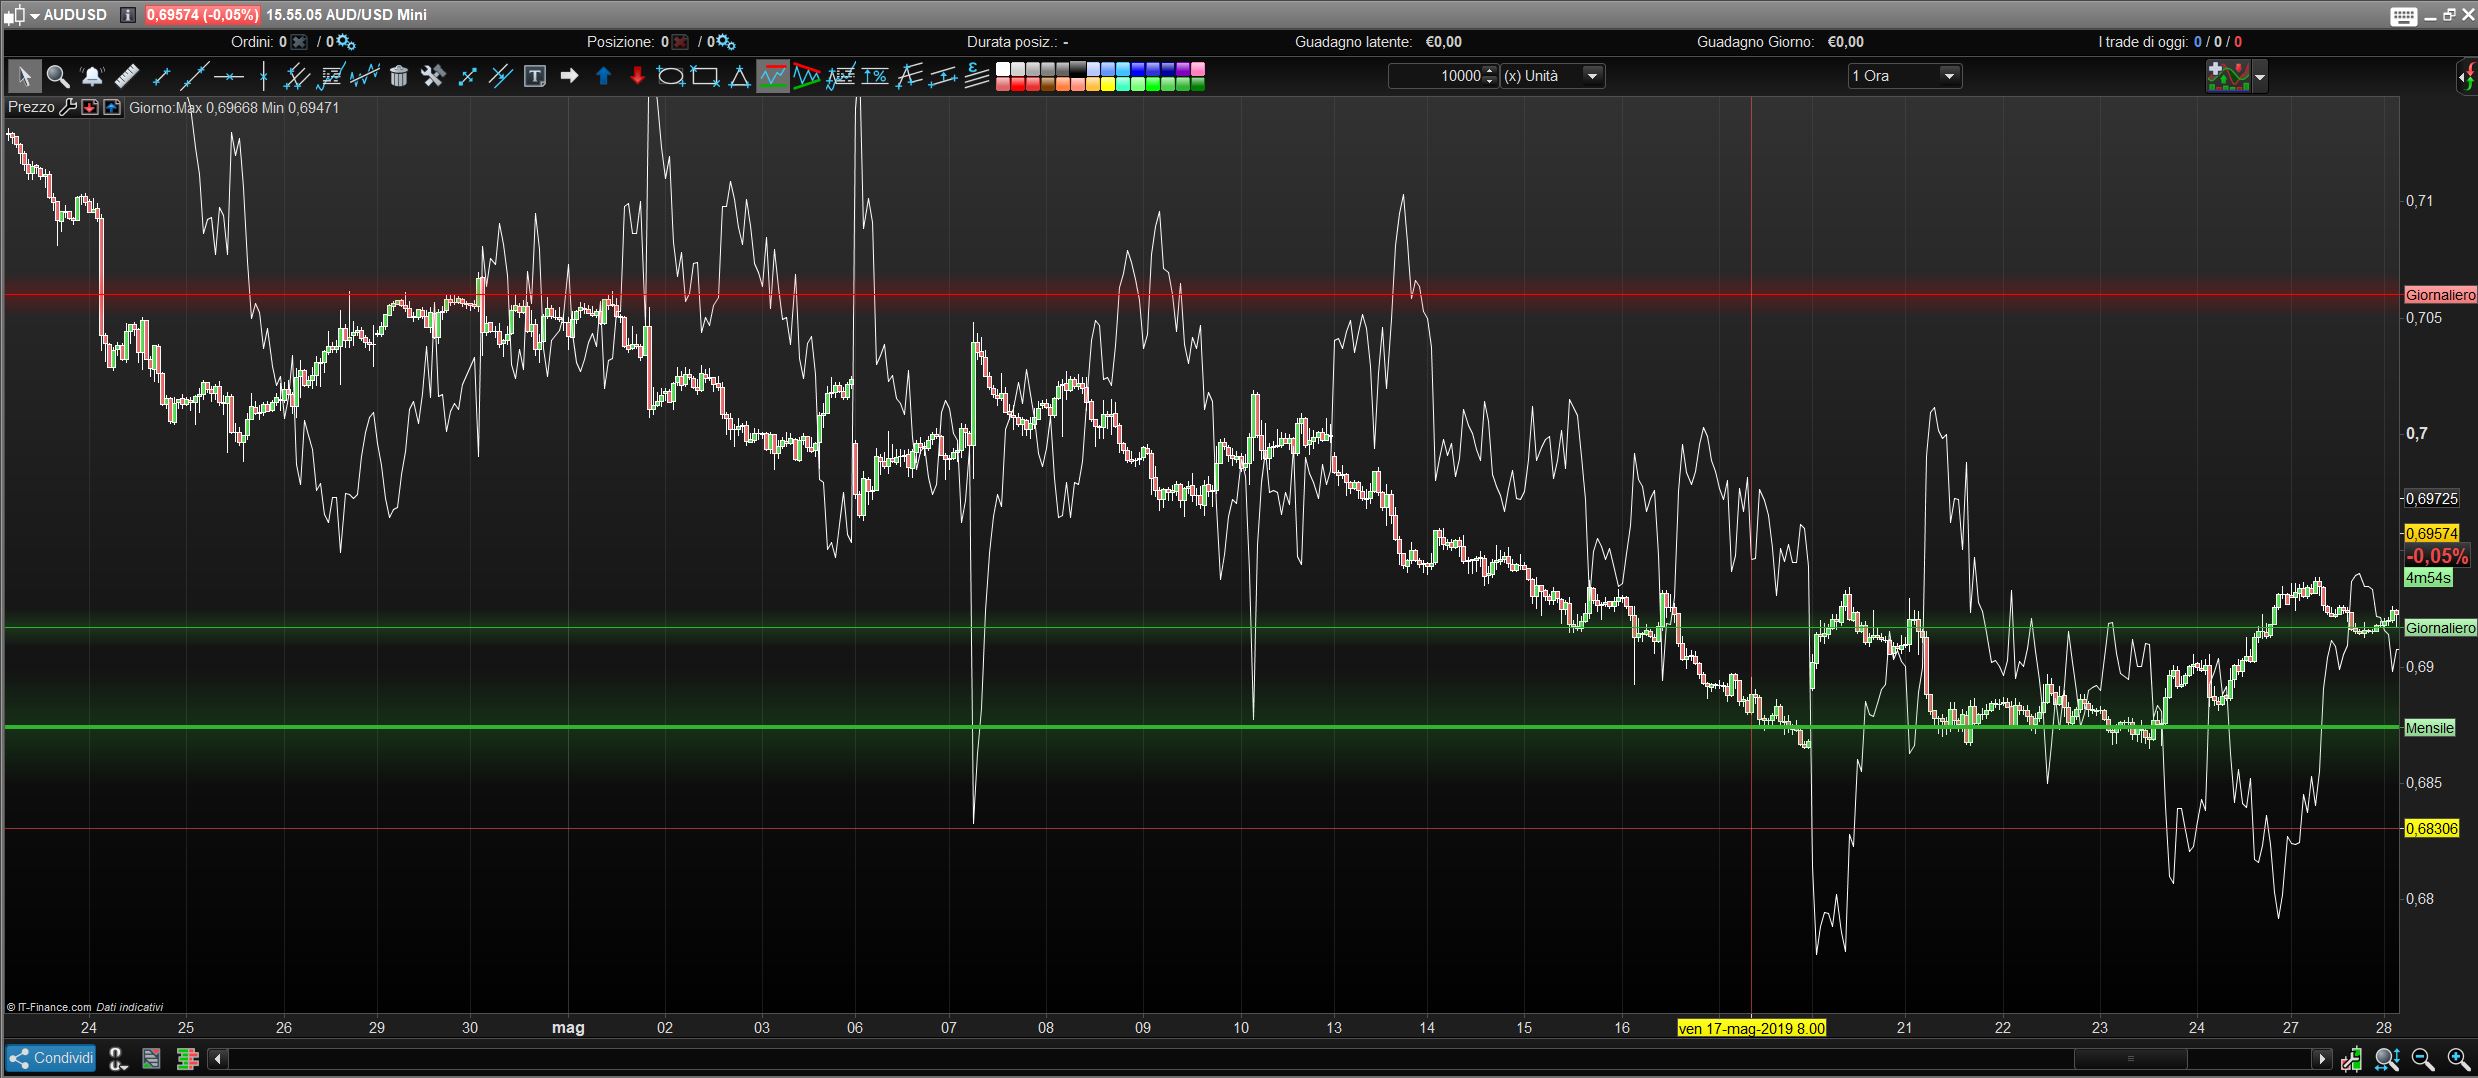
This is an onchart version of the RSI, that acts like a supertrend above and below price.
Upper and lower limit are set to 90 and 10.
It can be used as signal for entries and/or for stop loss.
//###################################################
//   RSI as SuperTrend
//   coded by AlexF
//###################################################

rsiperiod=14
rsihiband=90
rsiloband=10

//RSI calculation
ep=(2*rsiperiod)-1
auc=ExponentialAverage[ep](abs(MAX(close-close[1],0)))
adc=ExponentialAverage[ep](abs(MAX(close[1]-close,0)))
x1=(rsiperiod-1)*(adc*rsihiband/(100-rsihiband)-auc)
x2 = (rsiperiod - 1) * ( adc * rsiLoBand / (100-rsiLoBand) - auc)
if x1>=0 then
 ub=close+x1
else
 ub=close+x1*(100-rsihiband)/rsihiband
endif
if x2>=0 then
 lb=close+x2
else
 lb=close+x2*(100-rsiloband)/rsiloband
endif
z=(ub+lb)/2


return z
Download
Filename:
RSI-Supertrend.itf
Downloads:
257
Master
Currently debugging life, so my bio is on hold. Check back after the next commit for an update.
Author’s Profile
Loading...