RSI Reverse Engineering indicator

RSI Reverse Engineering indicator

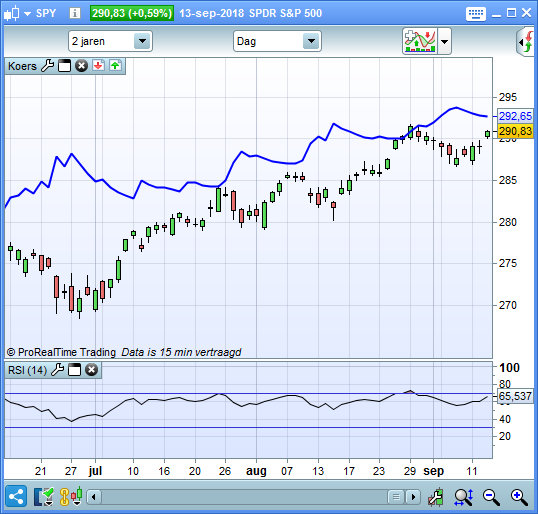
With the RSI Reverse Engineering indicator, you are able to calculate the price of the next candle on a certain value of the RSI. E.g. what price is needed for the RSI to be at 70 on the next candle.

Share this

Risk disclosure:

No information on this site is investment advice or a solicitation to buy or sell any financial instrument. Past performance is not indicative of future results. Trading may expose you to risk of loss greater than your deposits and is only suitable for experienced investors who have sufficient financial means to bear such risk.

ProRealTime ITF files and other attachments : How to import ITF files into ProRealTime platform?

PRC is also on YouTube, subscribe to our channel for exclusive content and tutorials

  1. Matt B • 09/14/2018 #

    Thank you Louis. I just download,
    Which system do you recommend ?

    • Louis Winthorp III • 09/14/2018 #

      Hi Matt, there is not a specific system. For traders using the RSI in their setup, with this indicator they can see which share price is needed on the next bar to achieve a certain value RSI value. Let’s say the RSI(x) is currently on 76, and you want to know the share price the next bar if the RSI would touch the 80 line. The indicator gives you the needed share price.

  2. Kosuda76 • 09/14/2018 #

    Hi Louis! This indicator has helped me a lot, has tried to get the RSI 30 extracted in the graph without success. Can you help me?

  3. Louis Winthorp III • 09/14/2018 #

    Hi Kosuda76, have you downloaded the rsi_revengineering.itf file? Then you can set any value you want. (The example code above contains hard coded 70 and 14 values)

  4. Kosuda76 • 09/14/2018 #

    Thanks for your reply! But I do not really understand what the opposite of them the values ​​you entered. ;-(

  5. AdriTrade • 09/14/2018 #

    Good job Louis!! How could do this for the Williams indicator? Thank you very much.

  6. imorandin • 09/14/2018 #

    Hi!, Nice code.
    I’m tryng to port it to another language, but I don’t understand this part:

    upMAOri = wilderAverage[RSIPeriod](UPOri)
    downMAOri = wilderAverage[RSIPeriod](DOWNOri)

    UpOri and DOWNOri seems to be prices (float) but wilderAverage function expects a collection of prices, right? can you explain?

    Thanks!,

    Ignacio

avatar
Register or

Likes

avatar avatar avatar avatar avatar avatar avatar avatar avatar avatar avatar avatar
Related users ' posts
supertiti hola Ivan Eso quiere decir que el Parabolic sar RSI est igual al parabolic sar de PRT ? p...
supertiti buenas tardes Ivan me gusteria tener lo mismo on chart con los puntos azules y rosas de c...
LucasBest Thanks for the translation. This one can be compared to dynamic zone RSI
Iván
1 month ago
luxrun grazie Ivàn!
lee Thank you. Is it possible to convert this to a screener that displays instruments when bulli...
Iván //---------------------------------------------------------------// //PRC_Pollan Indicator /...
Faisalx ChatGPT Hola Iván. Gracias por tu excelente trabajo. Te agradecería si pudieras echarle un...
Iván ok, perfecto! me pongo con ello
Iván Hi, Sorry, but what do you mean?
luiskohnen Hola, queria saber si el indicador repinta, porque a mi me parecio que si. Saludos y gracias...
Diamant Bonsoir, L'un d'entre vous peut-il me donner les définissions de LL-HH-LH et HL. Merci d'av...
Bernard13 (Je réécris mon commentaire -français- en français car certains mots ne correspondaient pas ...
Iván 1000 indicateurs !!! brutaux
Iván Gracias! Para el screener sólo tienes que copiar el indicador y poner como condición de búsq...
Lean Muchas gracias Iván, ya lo he podido crear.
bertoluce Hello Ivan, thank you very much for the indicator. An observation: would it be possible (and...
Bateson
2 years ago
Matriciel Very nice job ! Is it possible to do the opposite because what interests me is to have the ...
YvesRobert Hi Matriciel, how can we do this, because stochastic is limited between 0 and 100 but price ...
Traderfox06 Dear zeiiermantrading, I really like your approach combining adaptive averages with MACD in...
jacquesgermain Hello IASD it's normal , when this occurs, uncheck RSI and MFI line and click then the MAC...
emiliobercial Thank you very much for sharing!
Carlose estoy de acuerdo con IASD Esta muy bien el MAD y el indicador en el precio no se ven bien...
bousalahane merci pour le partage de cet l'indicateur, j'ai rajouté un autre indicateur pour faire une s...
joaoarcher Hi, thank you for the this. Is it possible to create a screener from this indicator, so that...
KumoNoJuzza Thanks. I did not know IG had Futures. I am always missing an info or a detail. I used to th...
joaoarcher Hi, thank you for the this. Is it possible to create a screener from this indicator, so that...
superfalcio Last very good gain of the system: positions on Eurostoxx50 closed yesterday friday 06/12/2024.
Nicolas
2 years ago
3 RSI
3 RSI
2
Indicators
Violet Nicolas, you calculate iRSI, but don't use it. You show RSI in the returned values, which, a...
Nicolas Yes, that's an error. RSI instruction is set by default to 14 if you don't indicate it that'...
DELBERT Bonjour , Nicolas , je voudrais installer cet indicateur sur ma PRT , version 10.3 , mais je...
Nicolas En effet, il faut à minima une version 11. La 10.3 est tellement ancienne maintenant.. Je pe...
DELBERT Bonjour , Nicolas , merci pour ta réponse , je fais un essai et je verrais . Salutations .

Top