

RSI Power Signal
August 10, 2020, 9:56 AM
Indicators
4 Comments
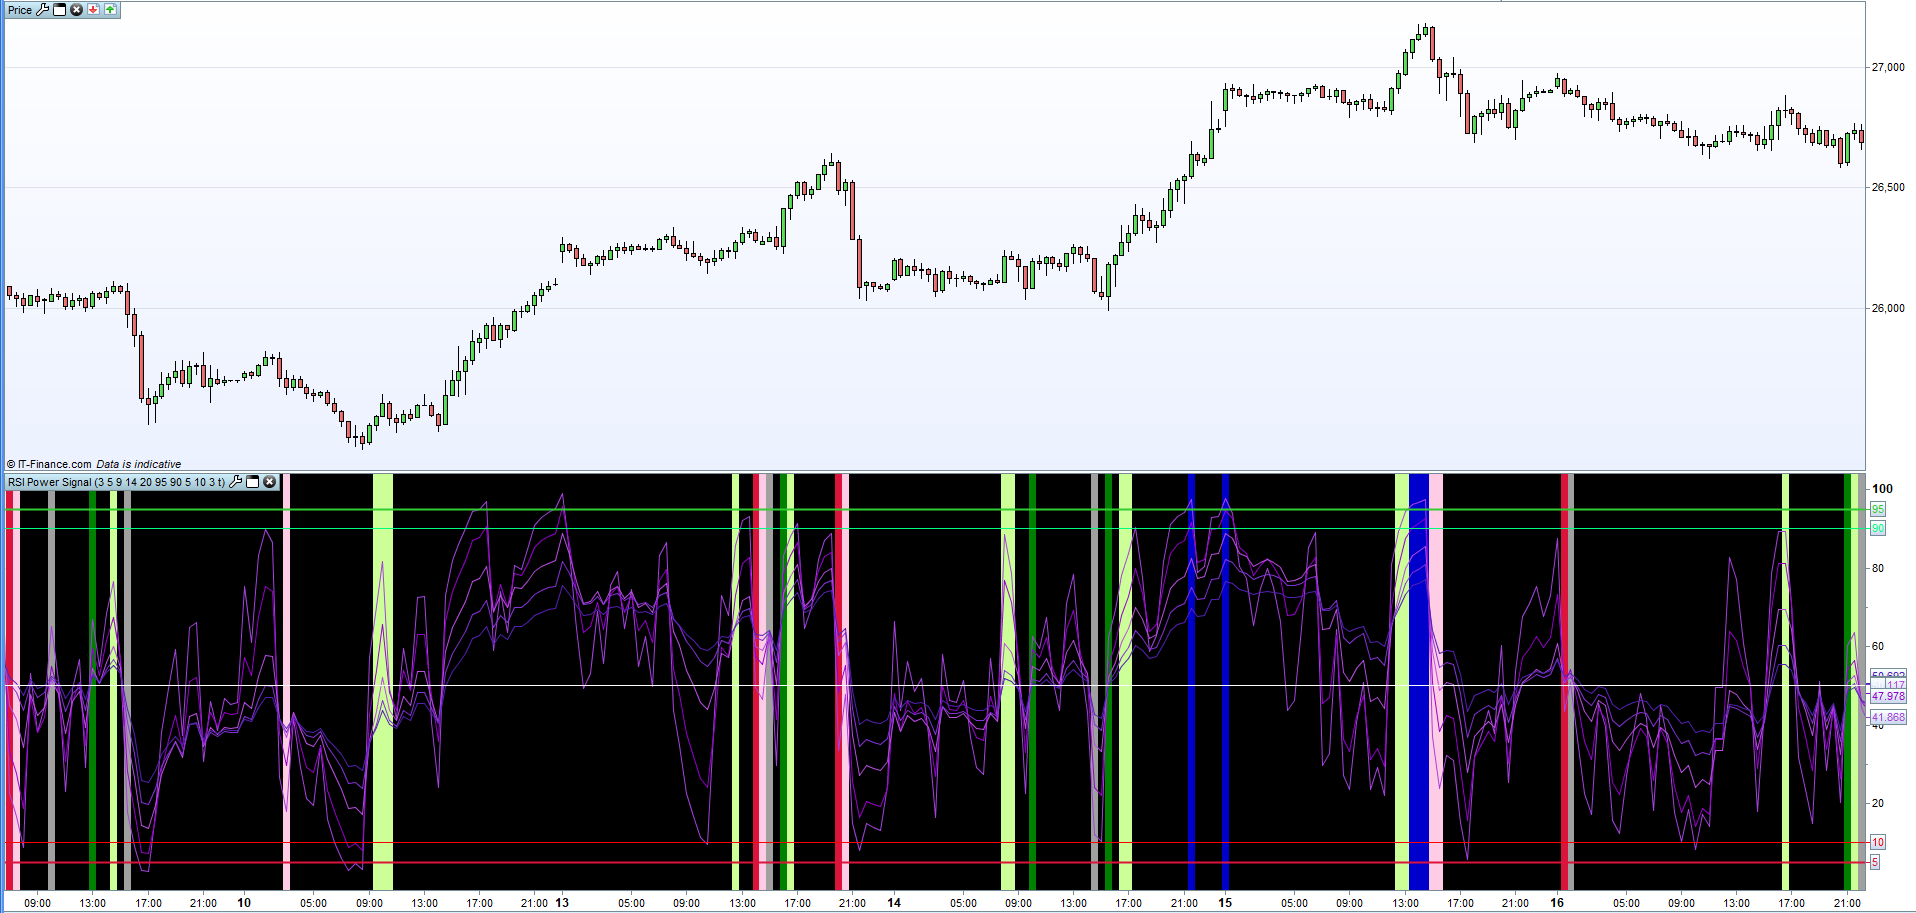
This indicator uses multiple RSI signals to find stress points and consequently a shift in trend strength and momentum. The signals are processed and then displayed as actionable bars:
Dark Green = Early Buy Signal
Dark Red = Early Sell Signal
Light Green = Buy Confirmation Signal (Consider Long Entry) / Exit Shorts
Pink = Sell Confirmation Signal (Consider Short Entry) / Exit Longs
Grey = Entry Invalidated, consider exit or use a tight trailing stop loss
Dark Blue & Magenta = Pullback Imminent
Defparam CalculateonLastBars = 10000

RSI1 = RSI[Period1](close)
RSI2 = RSI[Period2](close)
RSI3 = RSI[Period3](close)
RSI4 = RSI[Period4](close)
RSI5 = RSI[Period5](close)

CS = ConfirmationSensitivity + 1

once LastColor = 0

If (RSI1[1] > RSI2[1] and RSI2[1] > RSI3[1] and RSI3[1] > RSI4[1] and RSI4[1] > RSI5[1]) and (RSI1 < RSI2 and RSI2 < RSI3 and RSI3 < RSI4 and RSI4 < RSI5) and round(RSI1[1]) <= BullishX1 Then
R = 220
G = 20
B = 60
LastColor = -1
ElsIf (RSI1[1] < RSI2[1] and RSI2[1] < RSI3[1] and RSI3[1] < RSI4[1] and RSI4[1] < RSI5[1]) and (RSI1 > RSI2 and RSI2 > RSI3 and RSI3 > RSI4 and RSI4 > RSI5) and round(RSI1[1]) >= BearishX1 Then
R = 0
G = 128
B = 0
LastColor = 1
ElsIf (RSI1[2] > RSI2[CS] and RSI2[CS] > RSI3[CS] and RSI3[CS] > RSI4[CS] and RSI4[CS] > RSI5[CS]) and (RSI1 < RSI2 and RSI2 < RSI3 and RSI3 < RSI4 and RSI4 < RSI5) Then
R = 255
G = 204
B = 229
If LastColor = 1 Then
LastColor = 0
EndIf
ElsIf (RSI1[CS] < RSI2[CS] and RSI2[CS] < RSI3[CS] and RSI3[CS] < RSI4[CS] and RSI4[CS] < RSI5[CS]) and (RSI1 > RSI2 and RSI2 > RSI3 and RSI3 > RSI4 and RSI4 > RSI5) Then
R = 205
G = 255
B = 153
If LastColor = -1 Then
LastColor = 0
EndIf
ElsIf (LastColor = -1 and min(RSI1,min(RSI2,min(RSI3,min(RSI4,RSI5)))) > 50) or (LastColor = 1 and max(RSI1,max(RSI2,max(RSI3,max(RSI4,RSI5)))) < 50) Then
R = 160
G = 160
B = 160
LastColor = 0
Else
R = 0
G = 0
B = 0
EndIf

If EnableTakeProfit Then
If round(RSI1) >= BullishX1 and round(RSI2) >= BullishX2 and LastColor > 0 Then
R = 0
G = 0
B = 204
ElsIf round(RSI1) <= BearishX1 and round(RSI2) <= BearishX2 and LastColor < 0 Then
R = 153
G = 0
B = 153
EndIf
endIf

BACKGROUNDCOLOR(R,G,B)

Return RSI1 coloured(164,66,220) as "RSI1", RSI2 coloured(150,0,205) as "RSI2", RSI3 coloured(185,76,225) as "RSI3", RSI4 coloured(132,49,215) as "RSI4", RSI5 coloured(84,32,180) as "RSI5", BullishX1 coloured(50,205,50) Style(Line,2), BullishX2 coloured(0,255,127) Style(Line,1), BearishX1 coloured(220,20,60) Style(Line,2), BearishX2 coloured(255,0,0) Style(Line,1), 50 coloured(255,255,255)
Download
Filename:
RSI-Power-Signal.itf
Downloads:
280
Master
My name is Juan Jacobs and I am an algorithmic trader and trading coach. After 7 years of corporate work as a Systems Analyst, I have decided to pursue my passion of trading on a full-time basis. My current focus area is that of 'smart' strategies based on 'Machine Learning'. You can find me at www.FXautomate.com or visit my PRC Marketplace Store here: https://market.prorealcode.com/store/fxautomate/
Author’s Profile
Loading...