

RSI overbought/oversold bands on price
April 18, 2017, 8:38 AM
Indicators
8 Comments
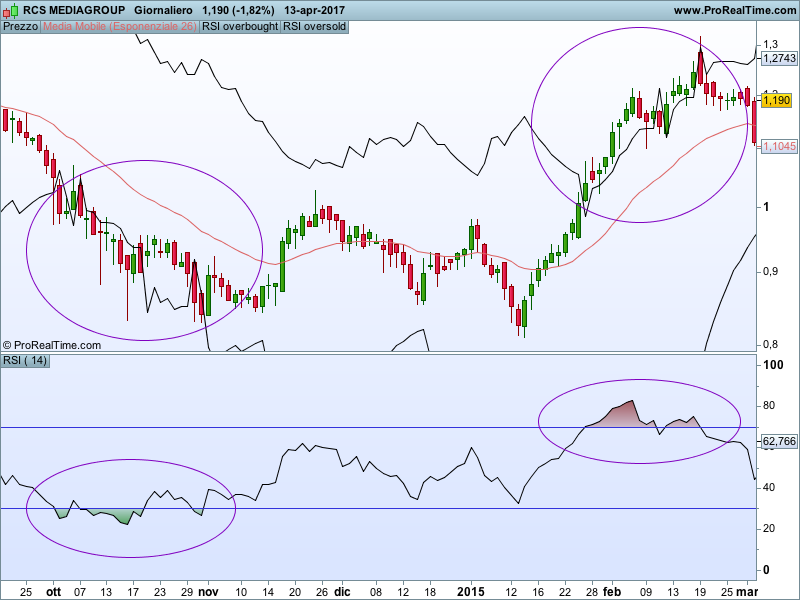
This code draws the overbought/oversold lines on the price. You can change the default values (70 and 30) with the one you like the most and you can also add a EMA[26](close) that represent perfectly the RSI-50 line.
Blue skies
// oversold-overbought RSI band on price

RSIsuplimit=70
RSIinflimit=30
a=rsi[14](close)

up=max(close-close[1],0)
down=max(0,close[1]-close)

avgUPieri=wilderaverage[14](up[1])
avgDOWNieri=wilderaverage[14](down[1])

//calcolo fasci superiore
if a[1]<=RSIsuplimit then
 RAPPsuplimit=RSIsuplimit/(100-RSIsuplimit)
 avgUPoggiRSIsuplimit=avgDOWNieri*RAPPsuplimit
 upSUPlimit=(avgUPoggiRSIsuplimit*14)-(avgUPieri*13)
else
 RAPPsuplimit=RSIsuplimit/(100-RSIsuplimit)
 avgDOWNoggiRSIsuplimit=avgUPieri/RAPPsuplimit
 downSUPlimit=(avgDOWNoggiRSIsuplimit*14)-(avgDOWNieri*13)
endif
if a<=RSIsuplimit then
 sup=close[1]+upSUPlimit
else
 sup=close[1]-downSUPlimit
endif
//calcolo fascia inferiore
if a[1]<=RSIinflimit then
 RAPPinflimit=RSIinflimit/(100-RSIinflimit)
 avgUPoggiRSIinflimit=avgDOWNieri*RAPPinflimit
 upINFlimit=(avgUPoggiRSIinflimit*14)-(avgUPieri*13)
else
 RAPPinflimit=RSIinflimit/(100-RSIinflimit)
 avgDOWNoggiRSIinflimit=avgUPieri/RAPPinflimit
 downINFlimit=(avgDOWNoggiRSIinflimit*14)-(avgDOWNieri*13)
endif

if a<=RSIsuplimit then
 sup=close[1]+upSUPlimit
else
 sup=close[1]-downSUPlimit
endif

if a<=RSIinflimit then
 inf=close[1]+upINFlimit
else
 inf=close[1]-downINFlimit
endif

return sup as "RSI overbought", inf as "RSI oversold"
Download
Filename:
Mio-rsi-su-prezzi.itf
Downloads:
349
Master
This author is like an anonymous function, present but not directly identifiable. More details on this code architect as soon as they exit 'incognito' mode.
Author’s Profile
Loading...