

RSI Donchian R1 Alerts
October 21, 2022, 9:31 AM
Indicators
3 Comments
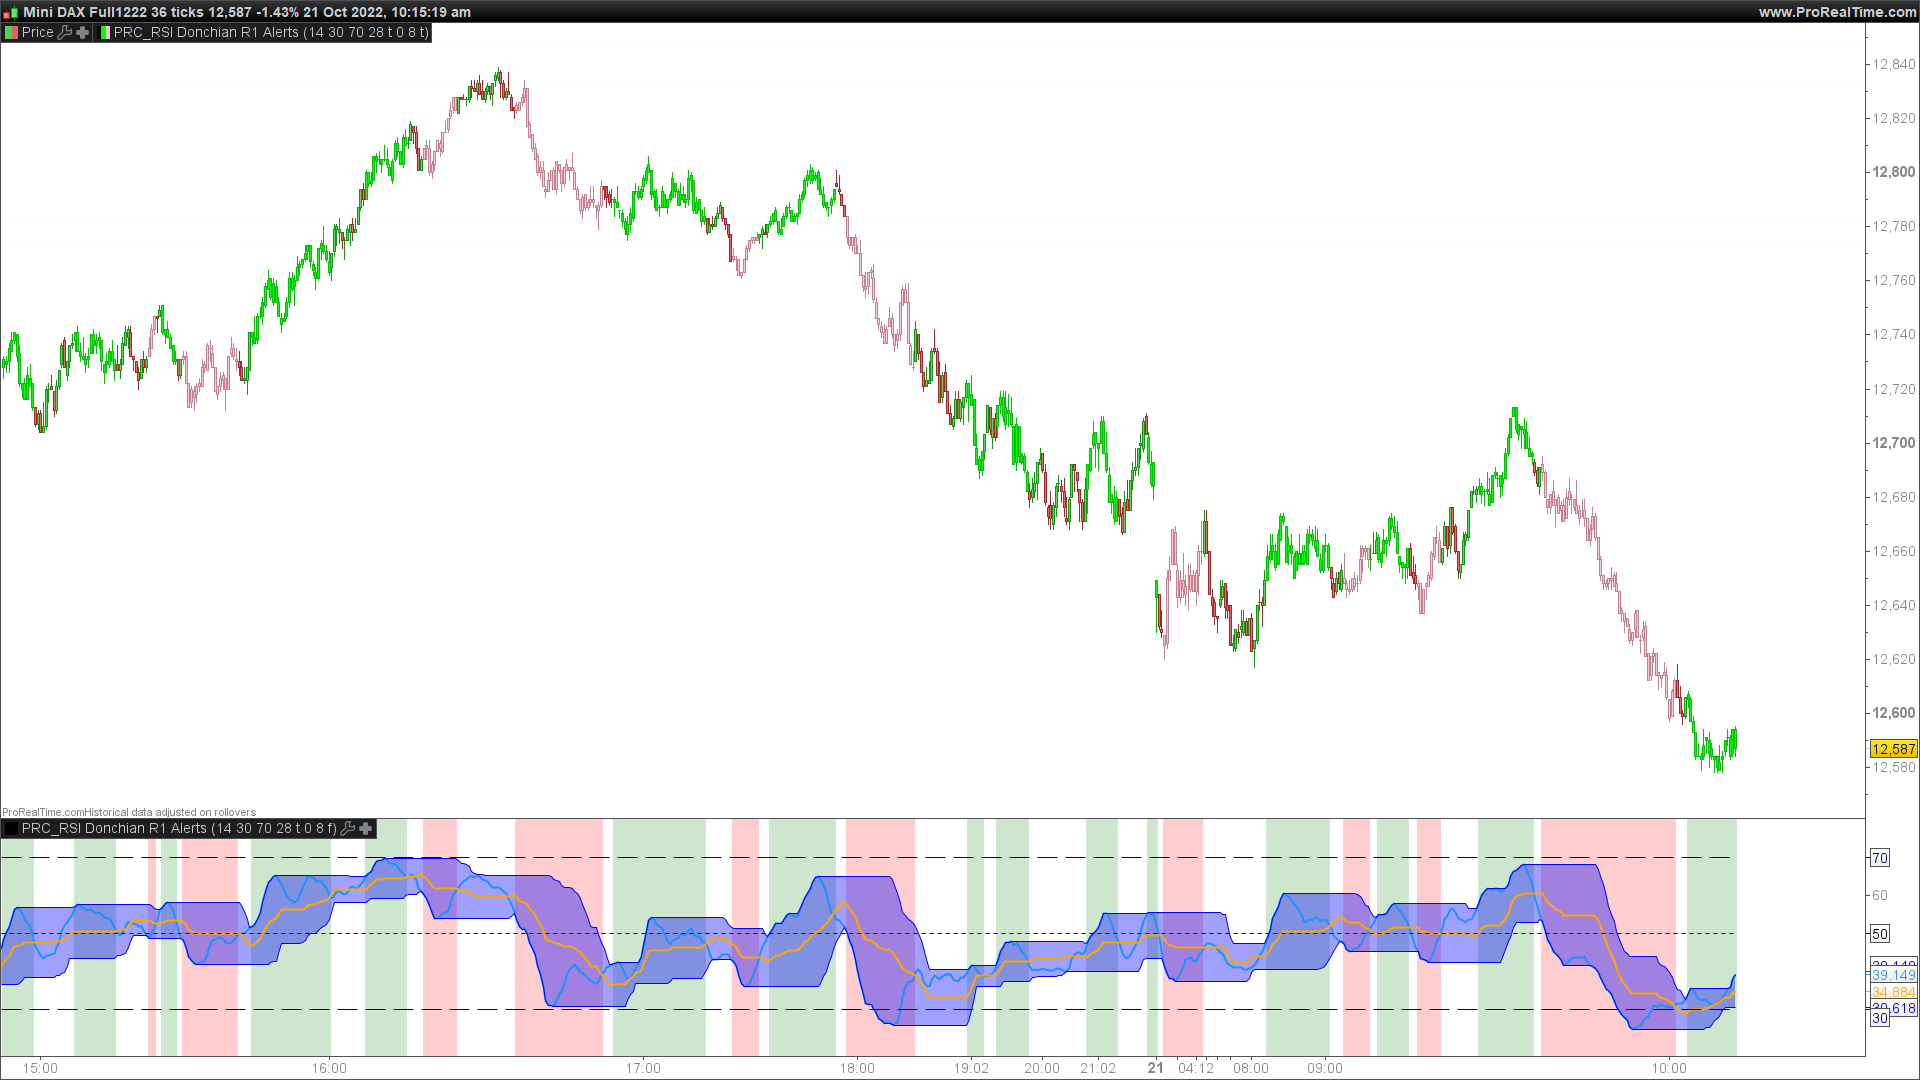
Donchian Channel (DC) on the RSI curve. The idea being that when RSI passes through the DC centre and touches the Highest/Lowest DC then price action tends to follow in the same direction and stay there until the RSI crosses DC centre line again.
There is also the option of applying MA smoothing to the RSI curve, the HullMA (8) is recommended (default).
(description from original author: JustUncleL)
//PRC_RSI Donchian R1 Alerts | indicator
//21.10.2022
//Nicolas @ www.prorealcode.com
//Sharing ProRealTime knowledge
//converted from pinescript

// --- settings
rsilength = 14 //RSI Period Length
rsios     =30 //RSI Oversold Level
rsiob     = 70 //RSI Overbought Level
donlength = 28 //Donchian Channel Lookback Length
uSmooth   = 0 //Apply MA Smoothing to RSI
matype   = 7 // MA type (0=SMA,1=EMA,2=WMA,3=Wilder,4=Triangular,5=End point,6=Time series,7 = Hull (PRT v11 only),8 = ZeroLag  (PRT v11 only))
malen    =8 //RSI MA Smooth - Length
sBars     = 0 //Colour Candles?
// --- end of settings

src       = customclose

// RSI calc
iRSI = rsi[rsilength](src)

// Smooth RSI if selected
if uSmooth then
maseries = average[malen,matype](iRSI)
ELSE
maseries = irsi
endif

// Calculate RSI Donchian Channel
lower = lowest[donlength](maseries)
upper = highest[donlength](maseries)
basis = (lower+upper)/2

// Look for Touches and Breaks of upper and lower channel
breakAbove = maseries >= upper[1]
breakBelow = maseries <= lower[1]

breakAboveB = maseries crosses over basis[1]
breakBelowB = maseries crosses under basis[1]

if breakabove then
trend=1
endif
if breakbelow then
trend=-1
endif
if breakaboveb or breakbelowb then
trend=0
endif

if not sbars then
if trend = 1 then
BACKGROUNDCOLOR ("green",50)
elsif trend = -1 then
BACKGROUNDCOLOR ("red",50)
endif
endif

colorbetween(upper,lower,"blue",95)

if sbars then
if trend =1 then
drawcandle(open,high,low,close) coloured("lime")
elsif trend=-1 then
drawcandle(open,high,low,close) coloured("pink")
endif
endif

return maseries coloured("dodgerblue") style(line,2) as "RSI curve",upper coloured("blue") as "Upper DC Band", lower coloured("blue") as "Lower DC Band", basis coloured("orange") style(line,2) as "DC Mid-Line",50 style(dottedline) as "RSI Centre",rsios style(dottedline1) coloured("navy") as "RSI lower boundary" , rsiob style(dottedline1) coloured("navy") as "RSI upper boundary"
Download
Filename:
PRC_RSI-Donchian-R1-Alerts.itf
Downloads:
265
Legend
I created ProRealCode because I believe in the power of shared knowledge. I spend my time coding new tools and helping members solve complex problems.
If you are stuck on a code or need a fresh perspective on a strategy, I am always willing to help. Welcome to the community!
Author’s Profile
Loading...