

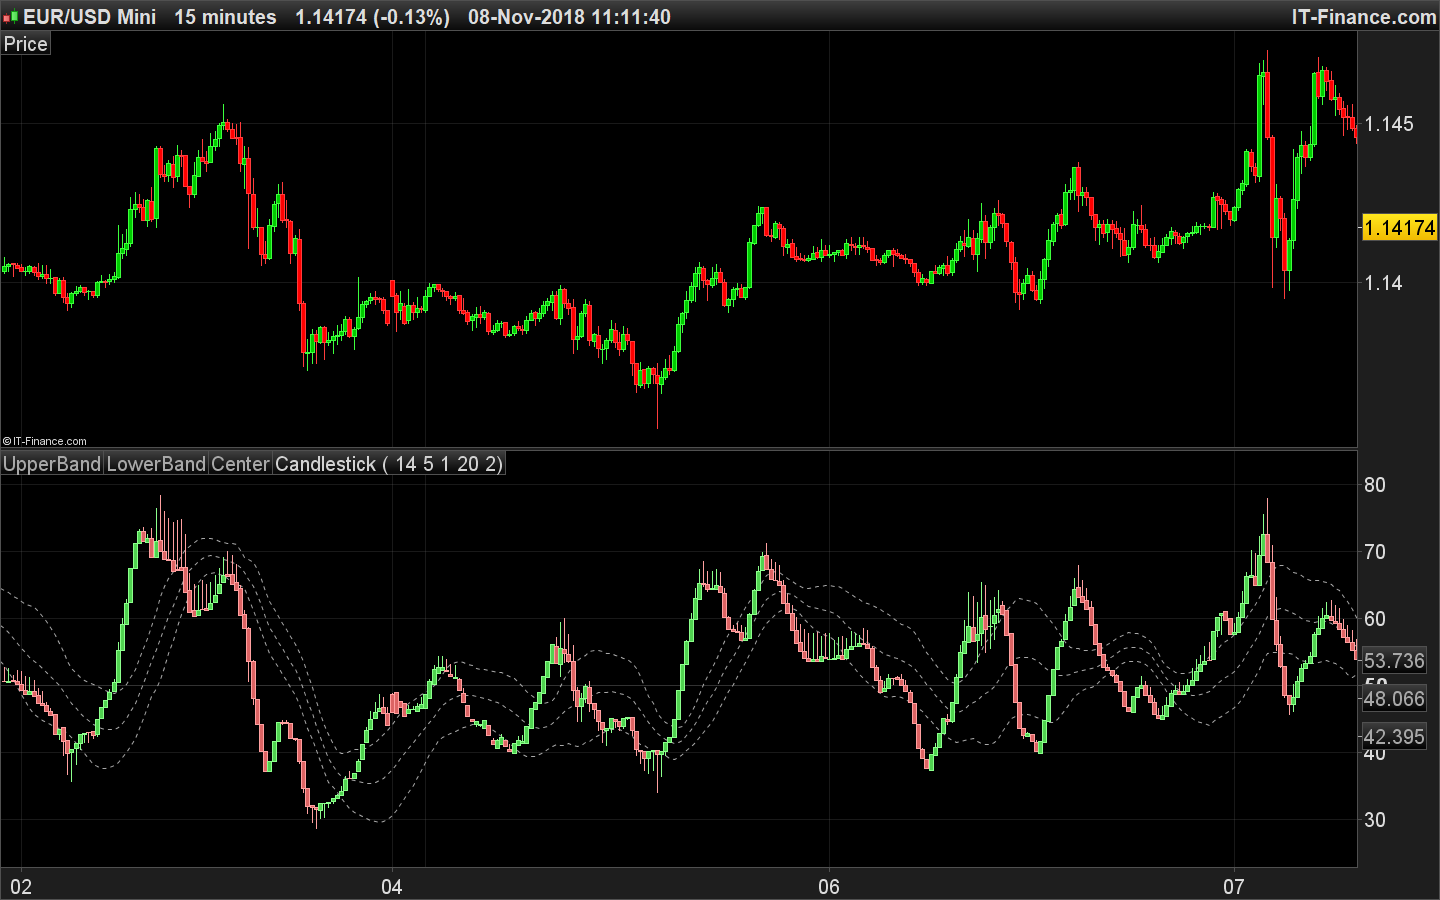
RSI candles smoothed with Keltner channel
November 8, 2018, 12:00 PM
Indicators
3 Comments
This indicator displays the RSI oscillator, with an option to smoothed it or not, in candlesticks form. Keltner bands are added to the oscillator to act as trend filtering and to detect high/low volatility phases of the market.
//PRC_RSI candles w KeltnerChan | indicator
//08.11.2018
//Nicolas @ www.prorealcode.com
//Sharing ProRealTime knowledge

// --- settings
RSIp = 14 //RSI period
SmoothPeriod = 3 //Smoothing period (0=no smoothing)
SmoothType = 1 //Moving average type for smoothing
lengthKC = 14 //Keltner bands Period
multKC = 1.5 //Keltner bands multiplier
// --- end of settings

SmoothPeriod=max(SmoothPeriod,1)
rsiH = average[SmoothPeriod,SmoothType](rsi[RSIp](high))
rsiL = average[SmoothPeriod,SmoothType](rsi[RSIp](low))
rsiO = average[SmoothPeriod,SmoothType](rsi[RSIp](open))
rsiC = average[SmoothPeriod,SmoothType](rsi[RSIp](close))
drawcandle(rsiO,rsiH,rsiL,rsiC)

price = (rsiH+rsiL+rsiC)/3
iRange = abs(rsiH-rsiL)
MA = Average[lengthKC](price)
UpperBand = MA + Average[lengthKC](iRange)*multKC
LowerBand = MA - Average[lengthKC](iRange)*multKC

return UpperBand coloured(168,168,168) style(dottedline,1) as "UpperBand",LowerBand coloured(168,168,168) style(dottedline,1) as "LowerBand",MA coloured(168,168,168) style(dottedline,1) as "Center"
Download
Filename:
PRC_RSI-candles-w-KeltnerChan.itf
Downloads:
301
Master
I created ProRealCode because I believe in the power of shared knowledge. I spend my time coding new tools and helping members solve complex problems.
If you are stuck on a code or need a fresh perspective on a strategy, I am always willing to help. Welcome to the community!
Author’s Profile
Loading...