

RSI + BB (EMA) + Dispersion
September 5, 2022, 11:45 AM
Indicators
3 Comments
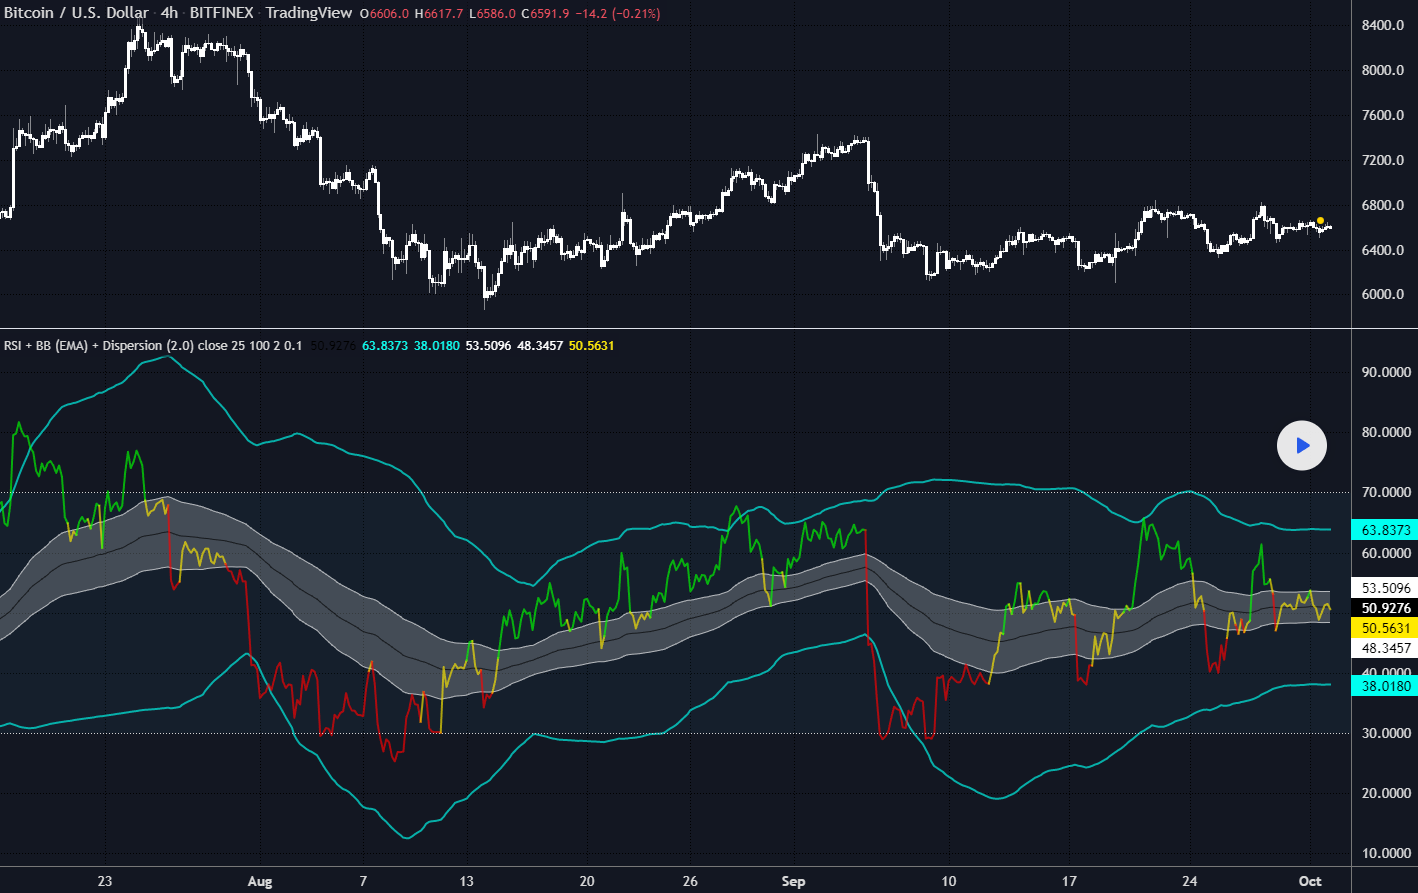
Just another RSI with 2 bollinger bands. Coded following a request in the indicator forum section.
Initial data:
1) RSI
2) Bollinger Bands (Basis – EMA )
3) Dispersion (around basis)
Signal for purchase: RSI crosses the dispersion zone upwards
Signal for sale: RSI crosses the dispersion zone downwards
Buffer zone: white area, it is not recommended to make transactions.
— Add (02.10.2018)
1) RSI lines (overbought / oversold) = 70 / 30. Сan be changed in the settings.
2) Alerts:
• RSI line crossover Dispersion Zone (green)
• RSI line crossunder Dispersion Zone (red)
//PRC_RSI+BB (EMA)+Dispersion | indicator
//05.09.2022
//Nicolas @ www.prorealcode.com
//Sharing ProRealTime knowledge
//converted from pinescript

// --- settings
forrsi = 14 //RSI_period
forma = 20 //Basis_BB
formult = 2 // Stdev
forsigma = 0.1 //Dispersion
// --- end of settings

src = customclose

currentrsi = rsi[forrsi](src)
basis = average[forma](currentrsi)
dev = formult * std[forma](currentrsi)
upper = basis + dev
lower = basis - dev
dispup = basis + ((upper - lower) * forsigma)
dispdown = basis - ((upper - lower) * forsigma)

if currentrsi>=dispup then
r=0
g=255
elsif currentrsi<=dispdown then
r=255
g=0
else
r=255
g=234
endif

colorbetween(70,30,"white",95)
colorbetween(dispup,dispdown,"white",80)

return 70 coloured(212,212,212,95) style(dottedline),30 coloured(212,212,212,95) style(dottedline), currentrsi coloured(r,g,0) style(line,2), basis, upper style(line,2) coloured(0,255,240), lower style(line,2) coloured(0,255,240), dispup coloured("white"), dispdown coloured("white")
Download
Filename:
PRC_RSIBB-EMADispersion.itf
Downloads:
335
Master
I created ProRealCode because I believe in the power of shared knowledge. I spend my time coding new tools and helping members solve complex problems.
If you are stuck on a code or need a fresh perspective on a strategy, I am always willing to help. Welcome to the community!
Author’s Profile
Loading...