

RSI and Linear Regression trading signals
September 25, 2020, 12:26 PM
Indicators
21 Comments
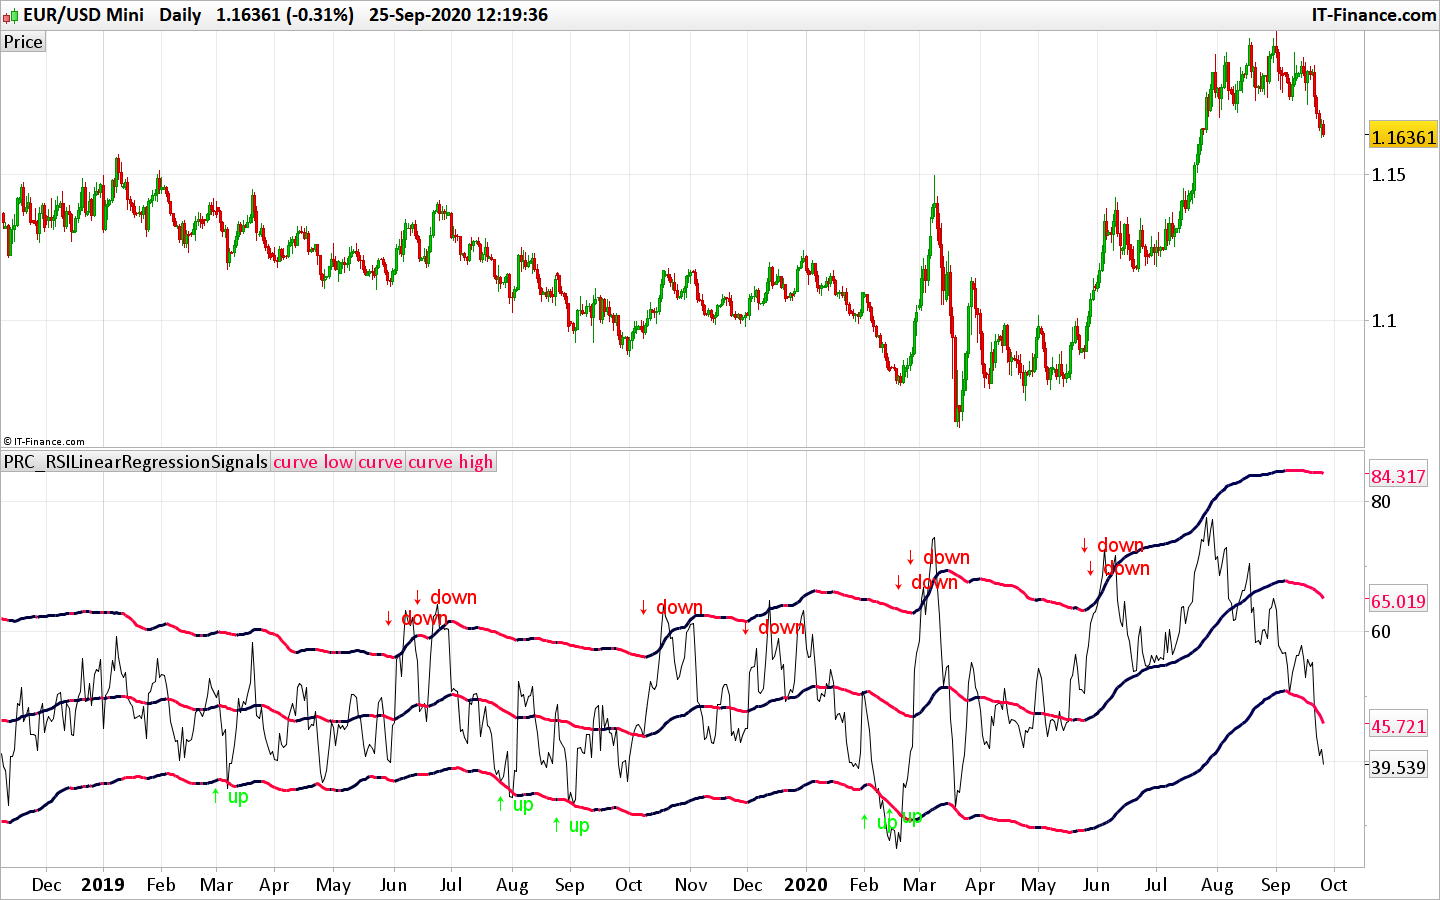
Trading signals based upon a linear regression channel applied to a classic RSI indicator.
If the RSI exceeds the upper band, the price should reverse to its mean and therefore a sell signals is announced.
If the RSI breaks the lower band, the price should reverse to its mean and a buy signals is plotted on the indicator.
You can adjust the RSI period of calculation (with variable ‘len’) and the linear regression channel period with “period”. The upper and lower band spread can be adjusted with the “deviations” setting (default is a 2 times multiplier from the mean).
//PRC_RSILinearRegressionSignals| indicator
//25.09.2020
//Nicolas @ www.prorealcode.com
//Sharing ProRealTime knowledge
//converted from tradingview
//https://www.prorealcode.com/topic/rsi-linear-regresion/

// --- settings
len = 21 //RSI Length
period     = 200 //Period
deviations = 2.0 //Deviation(s)
// --- end of settings

irsi = rsi[len](close)
periodMinusOne = period-1

Ex = 0.0
Ey = 0.0
Ex2 = 0.0
Exy = 0.0
for i=0 to periodMinusOne
closeI = (irsi[i])
Ex = Ex + i
Ey = Ey + closeI
Ex2 = Ex2 + (i * i)
Exy = Exy + (closeI * i)
ExEx = Ex * Ex
next
//slope
if Ex2=ExEx  then
slope = 0.0
else
slope= (period * Exy - Ex * Ey) / (period * Ex2 - ExEx)
endif
ilinearRegression = (Ey - slope * Ex) / period
intercept = ilinearRegression + barindex * slope
deviation = 0.0
for i=0 to periodMinusOne
deviation = deviation + square((irsi[i]) - (intercept - slope * (barindex[i])))
next
deviation = deviations * sqrt(deviation / periodMinusOne)
startingPointY = ilinearRegression + slope / periodMinusOne
//lineColor
if startingPointY > startingPointY[1] then
//color.blue
r=0
b=255
else
//color.red
r=255
b=0
endif
a = startingPointY-deviation
c1 = startingPointY
b = startingPointY+deviation

up=irsi crosses over a
down=irsi crosses under b
if up then
drawtext("↑ up",barindex,irsi-5,dialog,standard,20) coloured(0,255,0)
endif
if down then
drawtext("↓ down",barindex,irsi+5,dialog,standard,20) coloured(255,0,0)
endif

return irsi, a coloured(r,0,b) style(line,3)  as "curve low",c1 coloured(r,0,b) style(line,3) as "curve", b coloured(r,0,b) style(line,3)  as "curve high"
Download
Filename:
PRC_RSILinearRegressionSignals.itf
Downloads:
937
Master
I created ProRealCode because I believe in the power of shared knowledge. I spend my time coding new tools and helping members solve complex problems.
If you are stuck on a code or need a fresh perspective on a strategy, I am always willing to help. Welcome to the community!
Author’s Profile
Loading...