






Rounding Bottom & Top Detector
Introduction
A rounding bottom, or saucer, is one of the slowest reversal patterns: selling pressure fades, price drifts sideways along a curved floor, and buyers gradually take over until the market climbs back to where the decline started. Its mirror image, the rounding top, marks a slow loss of momentum at the end of an advance. Both are easy to see in hindsight and hard to define with rules.
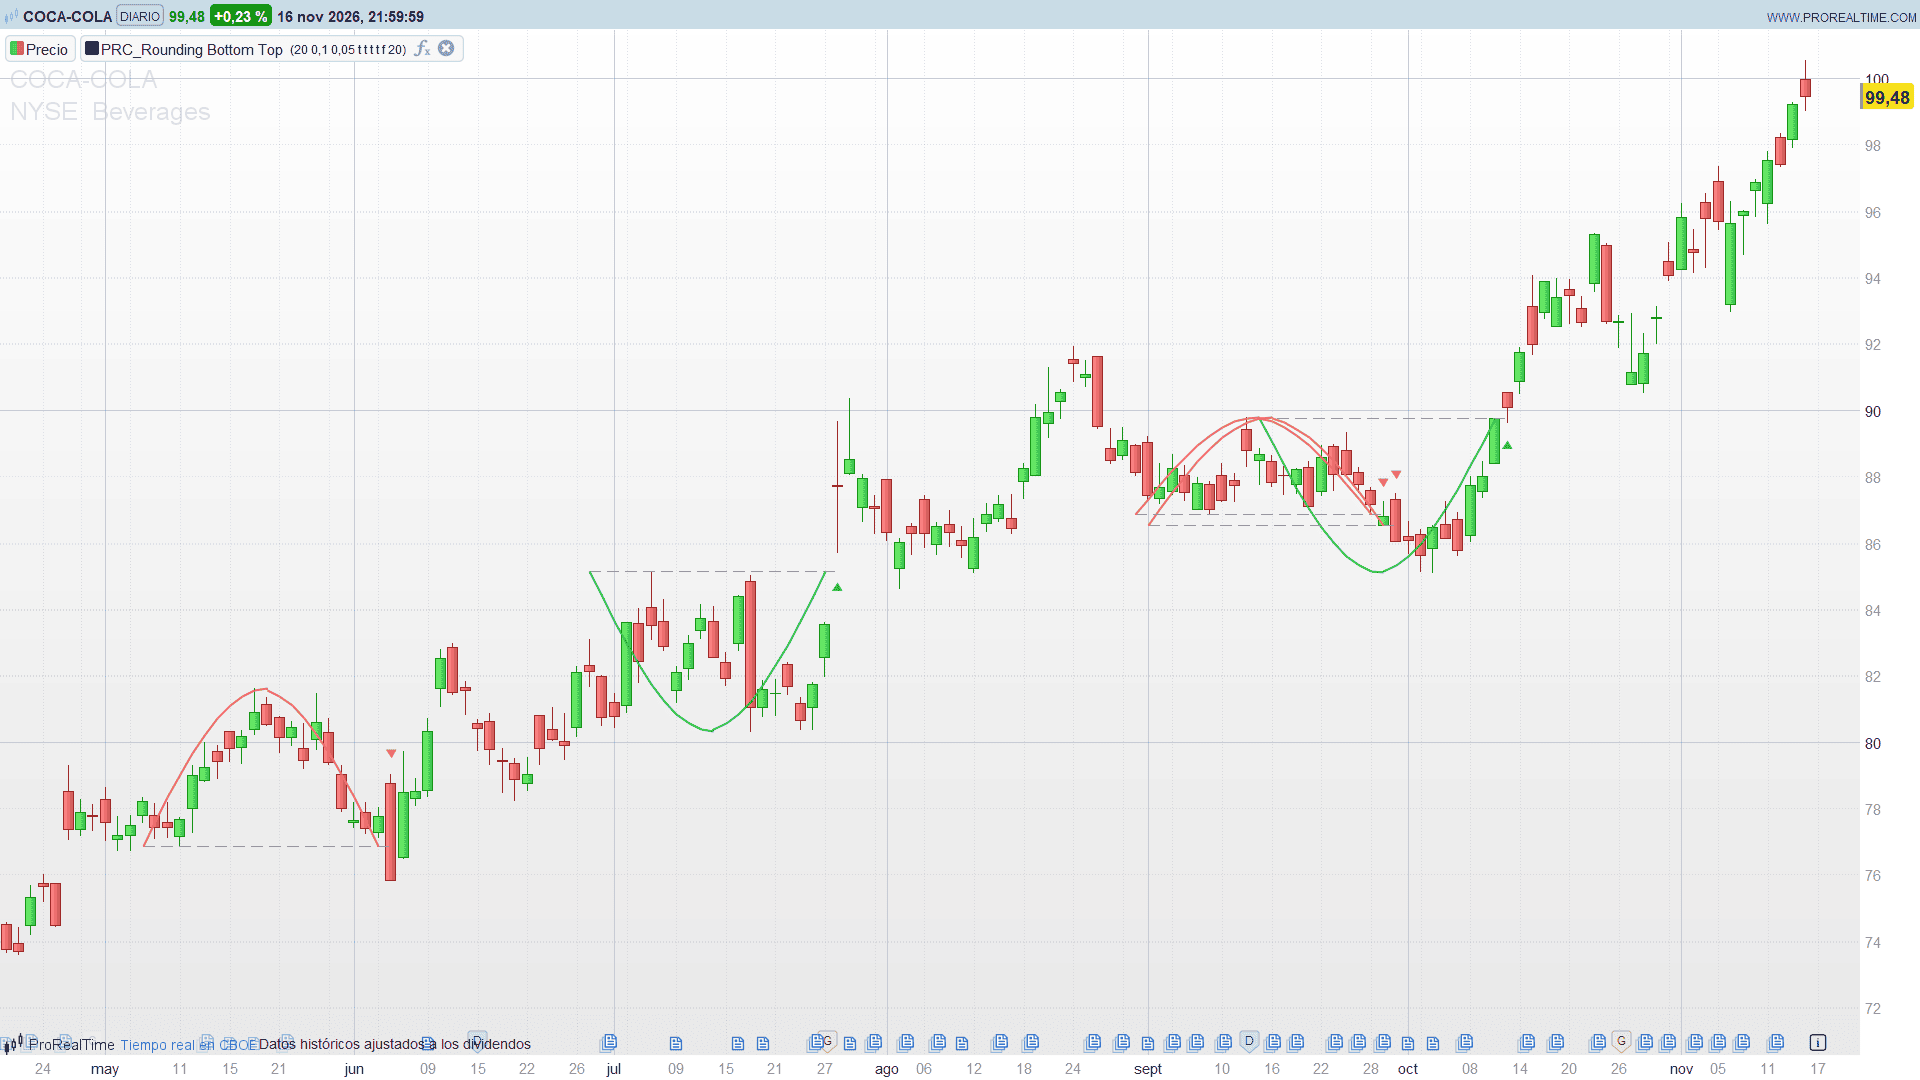
The Rounding Bottom & Top Detector, by Jos-ProTrader, gives them a precise, testable definition. It checks a fixed window of bars for a symmetric bowl (or dome), waits for a confirmed close beyond the rim and then draws the curved formation, the rim level and a breakout marker directly on the price chart.
Theory Behind the Indicator
On every bar the indicator looks at the previous lookback bars (30 by default) and splits them into a left half and a right half.
Rounding bottom.
- The rims are the highest high of each half. They must be similar: the relative difference between them may not exceed ten times the Edge Similarity value, in percent (2 % with the default 0.20).
- The lowest low of the window must sit near the middle of the formation, between 25 % and 75 % of the window. A low at either end means a slide or a V, not a bowl.
- The bowl must have some depth: the higher rim must be at least one tick above the lowest low.
- The breakout: the close must exceed the higher rim by the Breakout Confirmation percentage (0.05 % by default).
Rounding top. The same rules turned upside down: the rims are the lowest lows of each half, the highest high must sit in the middle of the window, and the close must fall below the lower rim by the confirmation percentage.
Signals are only taken on closed bars, so a pattern never appears and disappears while a bar is still forming.
When a pattern is confirmed, the curve is drawn as a half sine wave made of short segments, from the rim down to the lowest low and back up again (or from the rim up to the highest high and back down), across the whole lookback window.
Key Features at a Glance
- Rounding bottoms (green) and rounding tops (red), each with its own switch.
- Curved formation drawn across the lookback window, with adjustable smoothness.
- Dashed support or resistance line at the rim of each pattern.
- Triangle under the breakout bar (bottoms) or above the breakdown bar (tops).
- Optional text labels on each breakout.
- Signals confirmed at the close of the bar.
- The chart keeps the 200 most recent lines and the 100 most recent labels, so older formations fade out while every breakout triangle stays visible.
How to Read the Indicator
- Green curve and triangle: price has completed a bowl and closed above its rim. The dashed line is the old resistance that should now act as support.
- Red curve and triangle: price has rolled over in a dome and closed below the lower rim, which becomes resistance.
- Several triangles in a row: the breakout condition stays true while the close holds beyond the rim, so a strong move can mark consecutive bars. The first one is the breakout bar.
- Shallow curve: a bowl only slightly deeper than the minimum is a weaker structure than a deep, wide one.
Practical Applications
- Reversal entries: buy the first close above the rim of a rounding bottom, with the stop below the middle of the bowl or below the rim on a retest.
- Retests: the dashed rim line is a natural level to watch for a pullback after the breakout.
- Exits on longs: a rounding top on a position that has run for a while is a classic sign of exhaustion.
- Timeframe choice: on intraday charts a 30-bar bowl is a short-lived structure; on daily and weekly charts it reflects a genuine change of hands. Increase the lookback to look for larger saucers.
Indicator Configuration
- lookback (default 30): number of bars of the formation, from 20 to 200.
- edgePct (default 0.20): edge similarity. The two rims may differ by up to ten times this value, in percent.
- breakoutPct (default 0.05): how far, in percent, the close must go beyond the rim to confirm the breakout.
- showBottom (default 1): detect rounding bottoms.
- showTop (default 1): detect rounding tops.
- showCurves (default 1): draw the curved formation.
- showLevels (default 1): draw the rim line.
- showSignals (default 0): text labels on each breakout.
- curveSteps (default 20): number of segments of each curve, from 8 to 40.
- maxLines (default 200) and maxLabels (default 100): how many of the most recent lines and labels stay on the chart.
The Code
//---------------------------------------------------------------
// PRC_Rounding Bottom Top
// version = 0
// 17.11.2026
// Iván González @ www.prorealcode.com
// Author: Jos-ProTrader
// Sharing ProRealTime knowledge
//--------------------------------------------------------------------//
defparam drawonlastbaronly = true
//--------------------------------------------------------------------//
// INPUTS
//--------------------------------------------------------------------//
lookback = 30          // pattern lookback in bars (20 to 200)
edgePct = 0.20         // edge similarity: the rims may differ up to 10 x this value, in %
breakoutPct = 0.05     // breakout confirmation (%) beyond the rim
showBottom = 1         // rounding bottoms (1 = on, 0 = off)
showTop = 1            // rounding tops
showCurves = 1         // curved formation
showLevels = 1         // support / resistance line of each pattern
showSignals = 0        // breakout labels
curveSteps = 20        // curve smoothness: segments per curve (8 to 40)
//--------------------------------------------------------------------//
// DRAWING LIMITS (the chart keeps only the most recent objects)
//--------------------------------------------------------------------//
maxLines = 200         // curve segments + level lines
maxLabels = 100        // breakout labels
//--------------------------------------------------------------------//
// PATTERN CALCULATIONS (bar being evaluated)
//--------------------------------------------------------------------//
halfLen = floor(lookback / 2)
// rims: highest / lowest of the left and right halves of the window
leftHigh = highest[halfLen](high)[halfLen]
rightHigh = highest[halfLen](high)[1]
leftLow = lowest[halfLen](low)[halfLen]
rightLow = lowest[halfLen](low)[1]
// extremes of the whole window (previous lookback bars)
patternLow = lowest[lookback](low)[1]
patternHigh = highest[lookback](high)[1]
atrV = averagetruerange[14](close)   // only used to place markers and labels
bottomRes = max(leftHigh, rightHigh)
topSup = min(leftLow, rightLow)
rawBot = 0
rawTop = 0
IF barindex > lookback + 1 THEN
   // position of the extremes inside the window (0 = previous bar)
   lowOffset = 0
   highOffset = 0
   FOR k = 1 TO lookback - 1 DO
      IF low[1 + k] < low[1 + lowOffset] THEN
         lowOffset = k
      ENDIF
      IF high[1 + k] > high[1 + highOffset] THEN
         highOffset = k
      ENDIF
   NEXT
   // relative difference between the two rims
   bottomEdgeDiff = abs(leftHigh - rightHigh) / max(abs(leftHigh), ticksize) * 100
   topEdgeDiff = abs(leftLow - rightLow) / max(abs(leftLow), ticksize) * 100
   // the extreme must sit near the middle of the window
   midLo = floor(lookback * 0.25)
   midHi = floor(lookback * 0.75)
   middleLow = lowOffset >= midLo AND lowOffset <= midHi
   middleHigh = highOffset >= midLo AND highOffset <= midHi
   bottomDepth = bottomRes - patternLow
   topHeight = patternHigh - topSup
   validBottom = bottomEdgeDiff <= edgePct * 10 AND bottomDepth > ticksize
   validTop = topEdgeDiff <= edgePct * 10 AND topHeight > ticksize
   // breakout beyond the rim
   bottomBreakout = close > bottomRes * (1 + breakoutPct / 100)
   topBreakdown = close < topSup * (1 - breakoutPct / 100)
   IF showBottom = 1 AND bottomBreakout AND middleLow AND validBottom THEN
      rawBot = 1
   ENDIF
   IF showTop = 1 AND topBreakdown AND middleHigh AND validTop THEN
      rawTop = 1
   ENDIF
ENDIF
//--------------------------------------------------------------------//
// CONFIRMED SIGNALS: only closed bars produce a pattern
//--------------------------------------------------------------------//
once nEv = 0
IF barindex > lookback + 2 THEN
   IF rawBot[1] = 1 THEN
      $evBar[nEv] = barindex - 1
      $evDir[nEv] = 1
      $evEdge[nEv] = bottomRes[1]
      $evExt[nEv] = patternLow[1]
      $evPx[nEv] = low[1]
      $evAtr[nEv] = atrV[1]
      nEv = nEv + 1
   ENDIF
   IF rawTop[1] = 1 THEN
      $evBar[nEv] = barindex - 1
      $evDir[nEv] = -1
      $evEdge[nEv] = topSup[1]
      $evExt[nEv] = patternHigh[1]
      $evPx[nEv] = high[1]
      $evAtr[nEv] = atrV[1]
      nEv = nEv + 1
   ENDIF
ENDIF
//--------------------------------------------------------------------//
// DRAWING (rebuilt on the last bar)
//--------------------------------------------------------------------//
IF islastbarupdate AND nEv > 0 THEN
   // breakout markers: every confirmed signal
   FOR e = 0 TO nEv - 1 DO
      mBar = $evBar[e]
      mPx = $evPx[e]
      mAtr = $evAtr[e]
      IF $evDir[e] = 1 THEN
         DRAWTEXT("▲", mBar, mPx - 0.5 * mAtr, dialog, bold, 12) COLOURED(10, 178, 102, 255)
      ELSE
         DRAWTEXT("▼", mBar, mPx + 0.5 * mAtr, dialog, bold, 12) COLOURED(255, 103, 103, 255)
      ENDIF
   NEXT
   // curves, levels and labels: newest first until each budget runs out
   lineLeft = maxLines
   labLeft = maxLabels
   e = nEv - 1
   WHILE e >= 0 AND (lineLeft > 0 OR labLeft > 0) DO
      eBar = $evBar[e]
      eDir = $evDir[e]
      eEdge = $evEdge[e]
      eExt = $evExt[e]
      ePx = $evPx[e]
      eAtr = $evAtr[e]
      IF eDir = 1 THEN
         cR = 10
         cG = 178
         cB = 102
      ELSE
         cR = 255
         cG = 103
         cB = 103
      ENDIF
      // 1) label (the last object the signal created)
      IF showSignals = 1 AND labLeft > 0 THEN
         IF eDir = 1 THEN
            DRAWTEXT("Rounding Bottom", eBar, ePx - 1.3 * eAtr, sansserif, bold, 11) COLOURED(cR, cG, cB, 255)
            DRAWTEXT("BREAKOUT ↑", eBar, ePx - 1.9 * eAtr, sansserif, bold, 11) COLOURED(cR, cG, cB, 255)
         ELSE
            DRAWTEXT("Rounding Top", eBar, ePx + 1.9 * eAtr, sansserif, bold, 11) COLOURED(cR, cG, cB, 255)
            DRAWTEXT("BREAKDOWN ↓", eBar, ePx + 1.3 * eAtr, sansserif, bold, 11) COLOURED(cR, cG, cB, 255)
         ENDIF
         labLeft = labLeft - 1
      ENDIF
      // 2) support / resistance line
      IF showLevels = 1 AND lineLeft > 0 THEN
         DRAWSEGMENT(eBar - lookback, eEdge, eBar, eEdge) COLOURED(145, 145, 155, 255) STYLE(dottedline2, 1)
         lineLeft = lineLeft - 1
      ENDIF
      // 3) curve, from its last segment back to the first
      IF showCurves = 1 THEN
         startX = eBar - lookback
         totalBars = lookback - 1
         sIdx = curveSteps - 1
         WHILE sIdx >= 0 AND lineLeft > 0 DO
            t1 = sIdx / curveSteps
            t2 = (sIdx + 1) / curveSteps
            // half sine between the rims (PRT trigonometry works in degrees)
            y1 = eEdge + (eExt - eEdge) * sin(180 * t1)
            y2 = eEdge + (eExt - eEdge) * sin(180 * t2)
            x1 = startX + floor(totalBars * t1 + 0.5)
            x2 = startX + floor(totalBars * t2 + 0.5)
            DRAWSEGMENT(x1, y1, x2, y2) COLOURED(cR, cG, cB, 255) STYLE(line, 2)
            lineLeft = lineLeft - 1
            sIdx = sIdx - 1
         WEND
      ENDIF
      e = e - 1
   WEND
ENDIF
RETURN