

Rolling Weekly Seasonality % and Gain
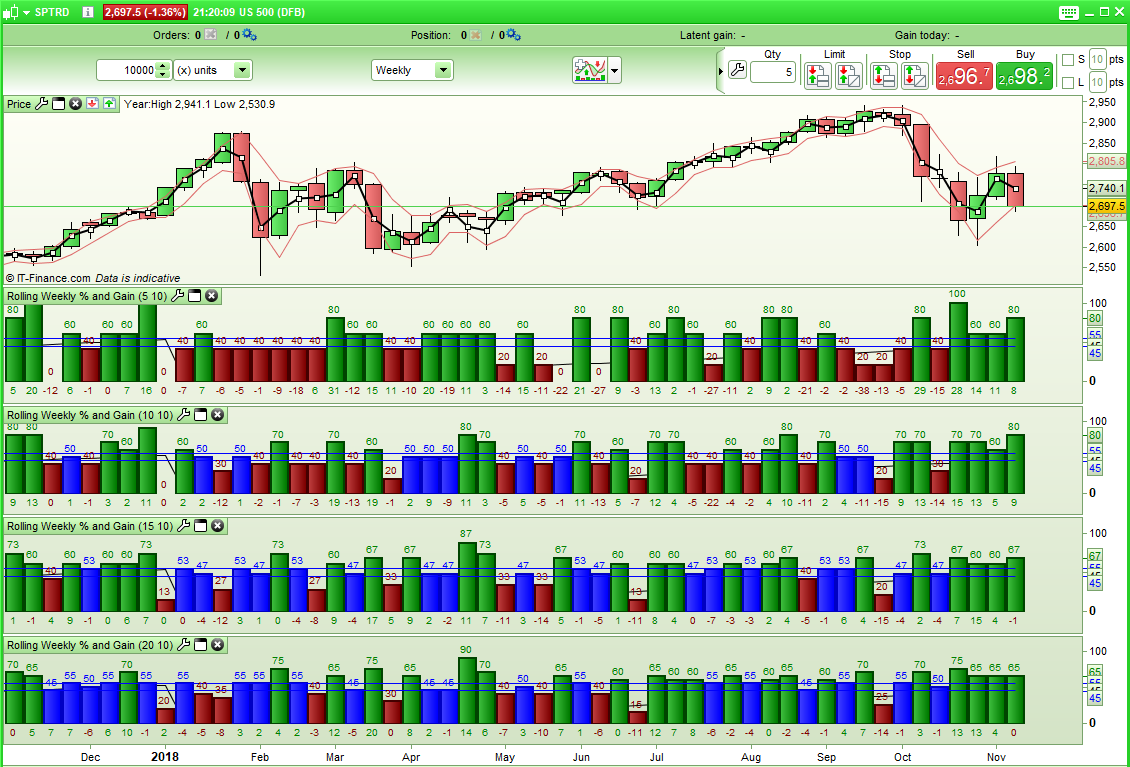
This seasonality indicator displays for each week of the year the percentage of up weeks and the average gain per week for each week of the year for a look back period. It can be used to test for any weekly seasonality in any market. Apply it only to the weekly chart of your chosen instrument
Look back periods of 5, 10, 15 and 20 years can be selected.
The histogram represents the percentage of weeks for that particular week number during the look back period where the close was greater than the open. The percentage is also displayed numerically above the histogram. The number under the histogram is the average gain per week for that particular week number during the look back period.
There is a variable called Insignificance Range. This is a percentage straddling 50% that highlights the histogram in blue to show that the number of up weeks in the look back period for that week is not significantly different to 50%. If set to 10 then any week with results from 45% to 55% will be highlighted in blue. Weeks above 55% will be green and those below 45% red.
Because the results are based on a rolling look back period the histogram bar under each candle represents the results at the close of the previous years candle for that week number. If you want to know whether next week has usually been a good week to go long or short then you will need to check the same week number in last years results. So for example if we are currently in week 15 2018 then you would need to look at week 16 2017 to see the analysis for next week. Hover over the indicator to see the week number as it may be different to PRT’s week number displayed on the chart.
If you apply all four indicators (5, 10, 15, 20 year rolling periods) to your weekly chart then you will be able to see if seasonality for any particular week has been strong across all test periods and whether it is getting stronger or weakening. Groups of weeks together can indicate longer periods where it has historically been good to go long or short any particular market.
When using the indicator you need to be wary of week 53’s that occur due to not every year having days that exactly divide into 52. The results for week 53 are not accurate or usable!
The code is very long at 4517 lines due to the lack of arrays at this time in PRT (or maybe just because I am a rather clunky coder! and that’s why it is not post under this description as usually in the library) so I advise downloading and importing the ITF file to get full functionality.