

Rolling POC Volume Profile indicator
Introduction
In modern technical analysis, understanding where traders are most active is crucial for identifying key support and resistance zones. The “Rolling POC Volume Profile” indicator is an advanced tool designed to visualize volume and the Point of Control (POC) within a specified range, thereby helping traders identify price levels where significant trading activity has occurred.
Description of the Indicator
The “Rolling POC Volume Profile” uses several components for its configuration:
Lookback Period (plook): Defines the number of bars back that the indicator considers to calculate volume.
Resolution (res): Determines the number of divisions within the analyzed price range.
Scale (scale): Adjusts the visual size of the volume bars on the chart.
Trend Length (hlen): Sets moving average POC length.
POC Smoothing (smoothPOC): Decides whether the POC is smoothed to facilitate visualization.
Show Channel (showchannel): Enables the display of the maximum and minimum prices within the lookback period.
Show Trend (showtrend): Activates the graphical representation of the trend based on the POC movement.
Functioning of the Indicator
POC Concept
The Point of Control (POC) is the price level within a specified range that has had the highest trading volume. This concept is fundamental because it indicates a price level to which traders have assigned the greatest importance, based on the amount of trading that has occurred.
POC Calculation
The indicator calculates the POC by analyzing the trading volume that occurs in different “bins” or price segments, within the range defined by the highest and lowest of the last plook bars. Each bin accumulates the volume of the price bars that fall within its range.
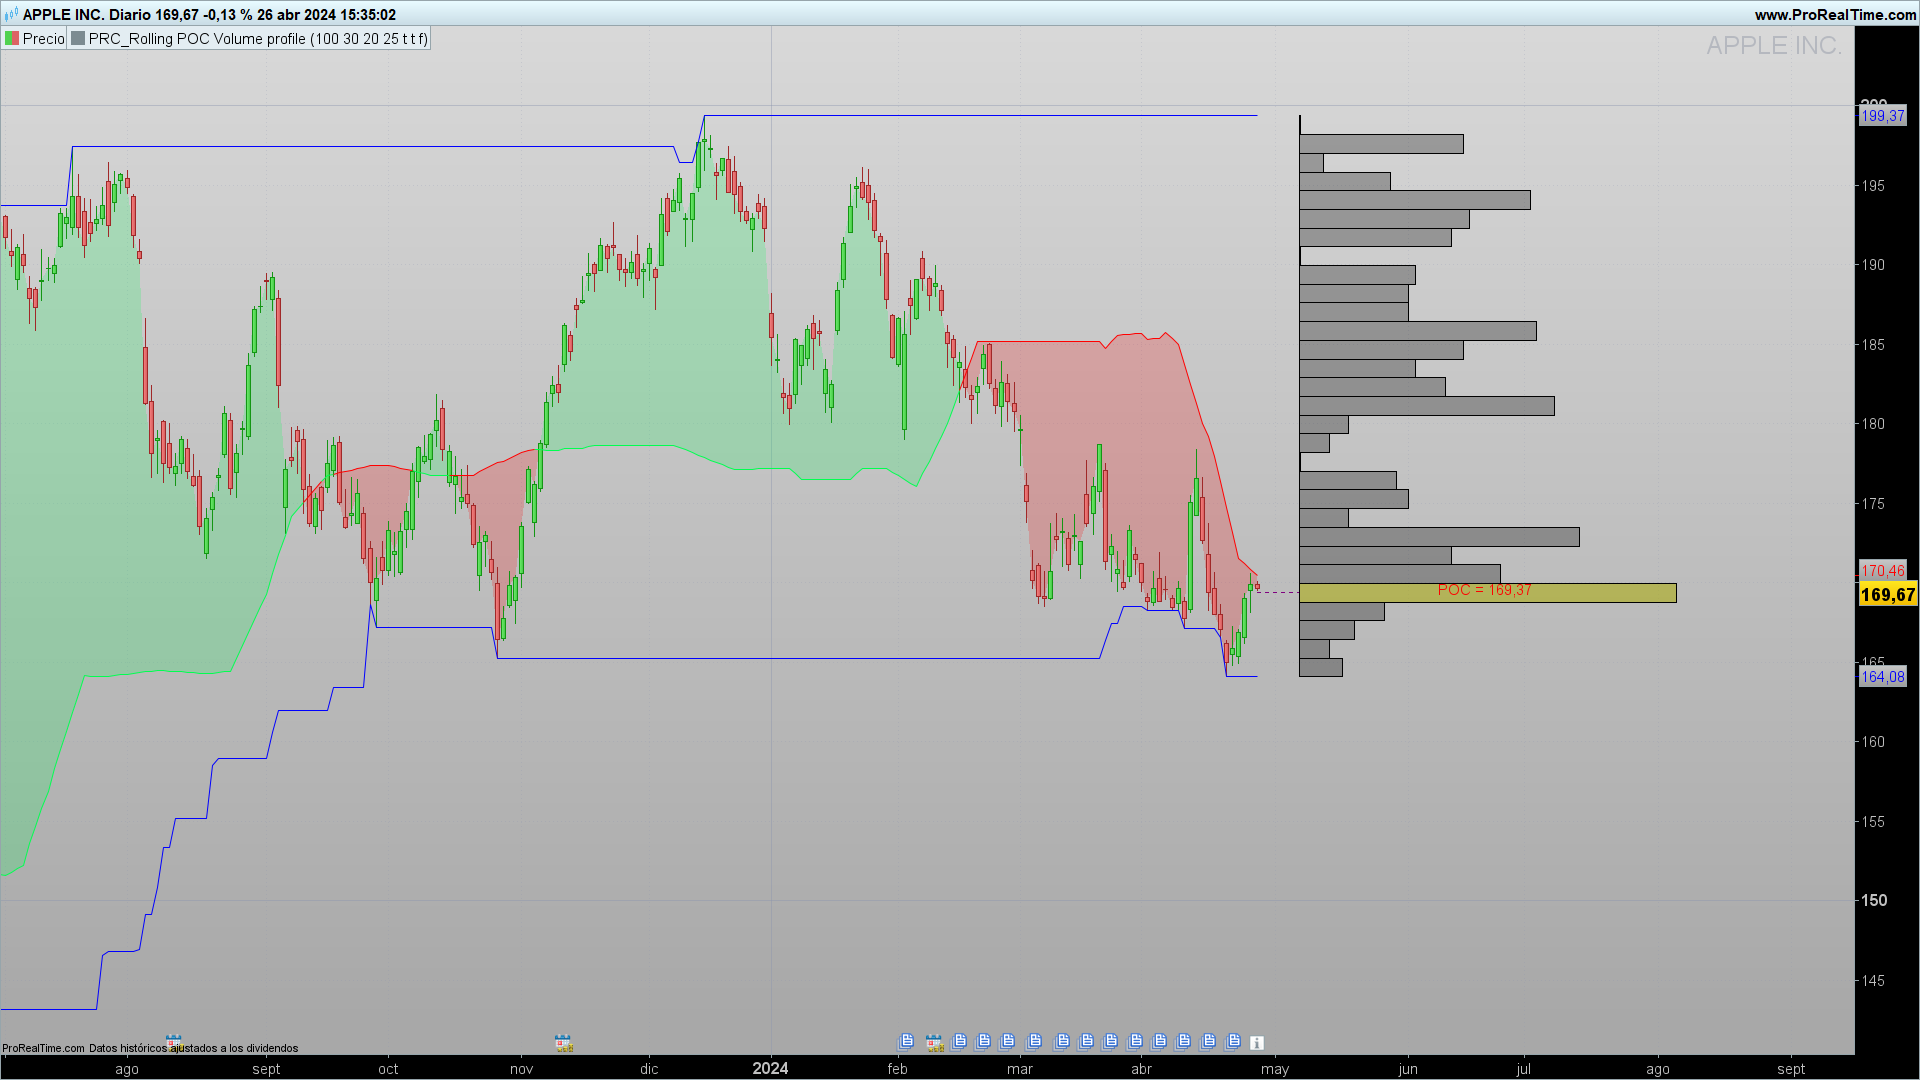
Next, the bin with the highest accumulated volume is identified, which is designated as the POC. This is visualized on the chart as a bar or line in a highlighted color, in this code yellow, to indicate that this price level has been the most traded.
Practical Applications
The indicator can be used to identify zones of high trading activity, which often correspond to key support or resistance levels. Traders can use this information to plan trade entries or exits, expecting prices to react at these levels.
Configuration and Customization
Traders can customize the indicator by adjusting the parameters of plook, res, and scale to adapt the analysis to different trading styles or time frames. This allows great flexibility in adapting the indicator to various market conditions.
Conclusions
The “Rolling POC Volume Profile” is a robust tool for traders looking to better understand market dynamics through trading volume. By providing a clear visualization of the most traded price levels, this indicator is invaluable for making informed trading decisions.
Indicator Code
The code for the indicator in ProBuilder of ProRealTime is provided below.
//------------------------------------------------------//
//PRC_Rolling POC Volume profile
//version = 0
//26.04.24
//Iván González @ www.prorealcode.com
//Sharing ProRealTime knowledge
//------------------------------------------------------//
defparam drawonlastbaronly = true
//-----Inputs-------------------------------------------//
plook=40
res=15
scale=30
hlen=25
smoothPOC=1
showchannel=1
showtrend=0
//------------------------------------------------------//
//-----Create arrays for High, Low and volume-----------//
maxx = highest[plook](high)
minn = lowest[plook](low)
step = (maxx-minn)/res //height of the rectangle
volsum=summation[plook](volume)
startbar = barindex+7
//------------------------------------------------------//
//-----Calculation POC----------------------------------//
for i=0 to res-1 do
binsize=0
volsize=0
mybot=minn+(i*step)
mytop=minn+((i+1)*step)
$bottomboundaries[i]=mybot
$topboundaries[i]=mytop
for j=0 to plook-1 do
if close[j]>=mybot and close[j]<=mytop then
volsize=volsize+volume[j]
endif
next
$VolLen[i]=volsize
volbar = (volsize*res/volsum)*scale
drawrectangle(startbar,mytop,startbar+volbar,mybot)fillcolor("black",70)
next

for k=0 to res-1 do
if $VolLen[k]=ArrayMax($VolLen) then
x = k
break
endif
next

poc = ($topboundaries[x]+$bottomboundaries[x])/2
//------------------------------------------------------//
//-----POC Bar and line---------------------------------//
drawrectangle(startbar,$topboundaries[x],startbar+($VolLen[x]*res/volsum)*scale,$bottomboundaries[x])fillcolor("yellow",90)
drawsegment(barindex,poc,startbar,poc)coloured("purple")style(dottedline)
mypoc = round(poc,2)
drawtext("POC = #mypoc#",round((startbar+startbar+($VolLen[x]*res/volsum)*scale)/2),poc+0.35*tr)coloured("red")
//-----POC Smoothed
if smoothPOC then
smPOC = average[max(1,round(sqrt(plook)))](poc)
else
smPOC = poc
endif
if close > smpoc then
r=0
g=255
b=80
else
r=255
g=0
b=0
endif
colorbetween(close,smPOC,r,g,b,50)
//------------------------------------------------------//
//-----Trend--------------------------------------------//
if showtrend then
hpoc = weightedaverage[hlen](poc)
if hpoc >= hpoc[1] then
rhpoc=0
ghpoc=255
else
rhpoc=255
ghpoc=0
endif
else
hpoc = undefined
endif
//------------------------------------------------------//
//-----Max and Min Channel------------------------------//
if showchannel then
rh = highest[plook](high)
rl = lowest[plook](low)
else
rh = undefined
rl = undefined
endif
//------------------------------------------------------//
return smPOC as "POC smoothed" coloured(r,g,b),rh as "Max High"coloured("blue"), rl as "Min Low"coloured("blue"),hpoc as "Trend" coloured(rhpoc,ghpoc,0)style(line,3)
