

RocketRSI by John Ehlers
May 6, 2018, 5:35 PM
Indicators
5 Comments
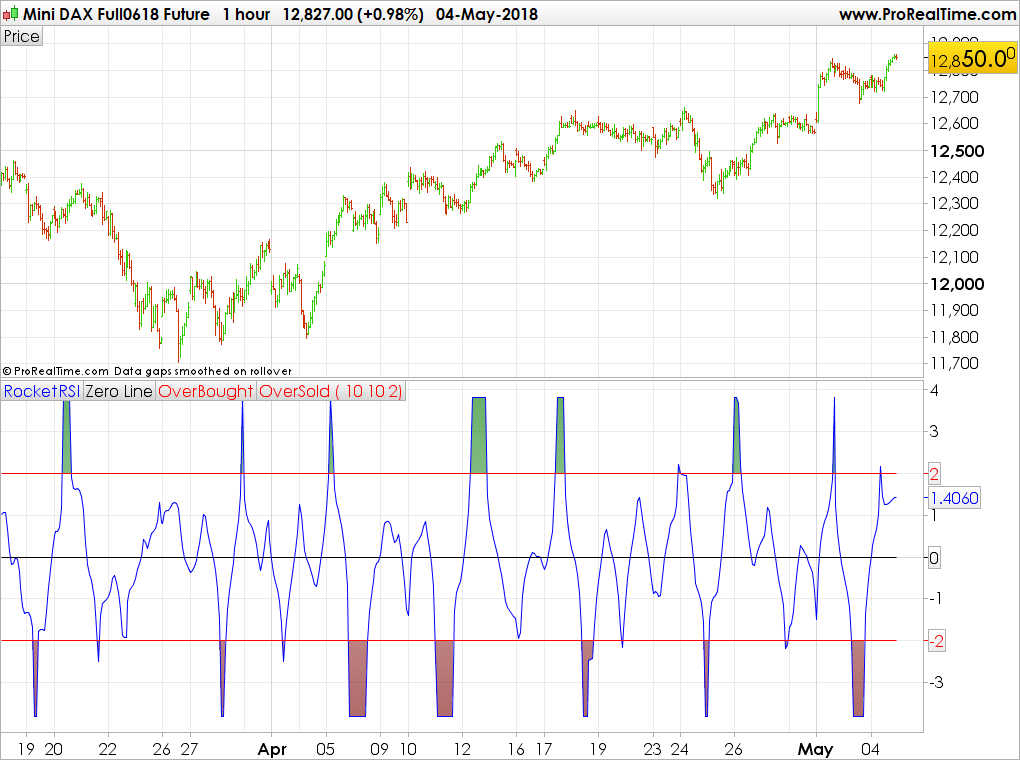
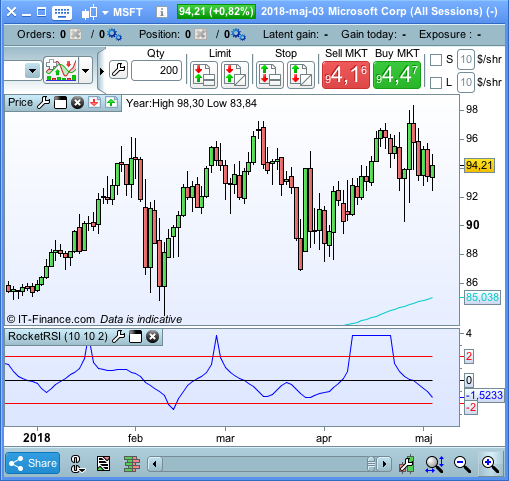
In “RocketRSI—A Solid Propellant For Your Rocket Science Trading” in the may 2018 issue of Traders tips, author John Ehlers introduces a new take on the classic RSI indicator originally developed by J. Welles Wilder. Ehlers begins by introducing a new version of the RSI based on a simple accumulation of up and down closes rather than averages. To this he applies a Fisher transform. He tells us that the resultant output is statistically significant spikes that indicate cyclic turning points with precision.
SmoothLength=10
RSILength=10
OBOSLevel=2

//Compute Super Smoother coefficients once
if barindex = 1 then
 a1 = exp( -1.414 * 3.14159/ ( SmoothLength ) )
 b1 = 2 * a1 * Cos( 1.414 * 180/ ( SmoothLength ) )
 c2 = b1
 c3 = -square(a1)
 c1 = 1 - c2 - c3
endif
if barindex > RSILength then
 //Create half dominant cycle Momentum
 Mom = Close - Close[RSILength - 1]

 //SuperSmoother Filter
 Filt = c1 * ( Mom + Mom[1] ) / 2 + c2 * Filt[1] + c3 * Filt[2]

 //Accumulate "Closes Up" and "Closes Down"
 CU = 0
 CD = 0
 for count = 0 to RSILength -1 do
  if Filt[count] - Filt[count + 1] > 0 then
   CU = CU + Filt[count] - Filt[count + 1]
  endif
  if Filt[count] - Filt[count + 1] < 0 then
   CD = CD + Filt[count + 1] - Filt[count]
  endif
 next

 if CU + CD <> 0 then
  MyRSI = ( CU - CD ) / ( CU + CD )
 endif

 //Limit RocketRSI output to
 //+/- 3 Standard Deviations
 MyRSI = min(max(MyRSI,-.999),.999)

 //Apply Fisher Transform to establish
 //Gaussian Probability Distribution
 RocketRSI = .5 * Log( ( 1 + MyRSI ) / ( 1 - MyRSI ) )
endif
return RocketRSI coloured(0,0,255) as "RocketRSI", 0 as "Zero Line", OBOSLevel coloured(255,0,0) as "OverBought", -OBOSLevel coloured(255,0,0) as "OverSold"
Download
Filename:
RocketRSI.itf
Downloads:
355
Download
Filename:
bildschirmfoto-um-1525422949c48lp.png
Downloads:
89
Download
Filename:
Bildschirmfoto-2018-02-20-um-11.21.22.png
Downloads:
74
Master
Developer by day, aspiring writer by night. Still compiling my bio... Error 404: presentation not found.
Author’s Profile
Loading...