Rex Oscillator

Rex Oscillator

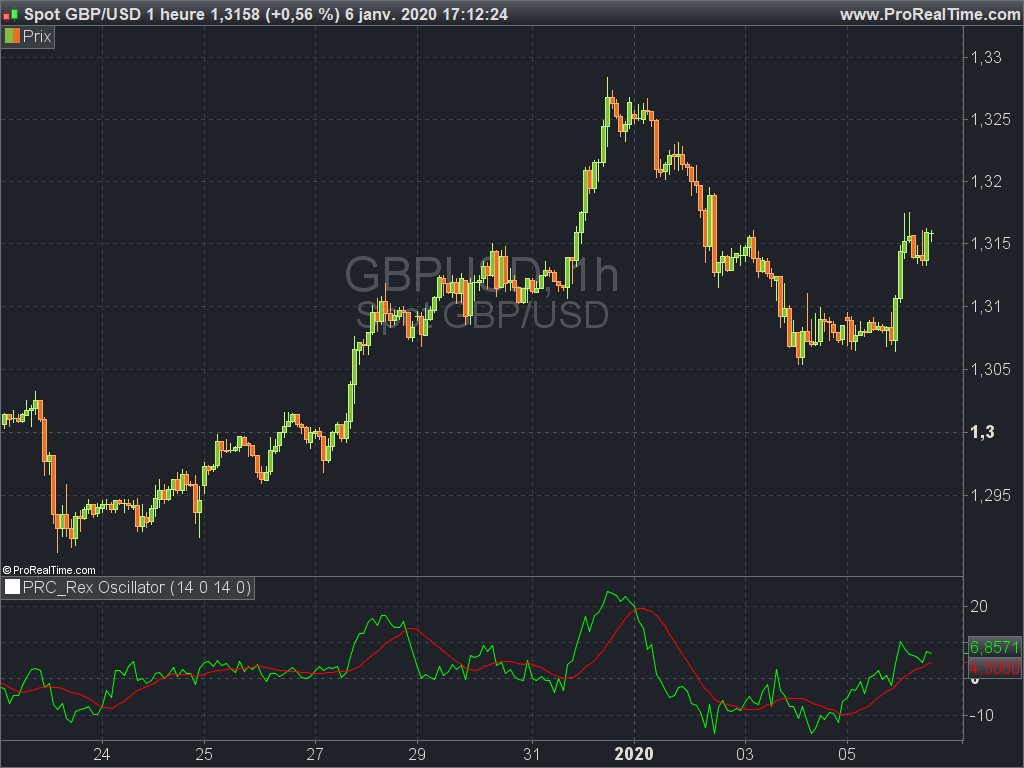
The Rex oscillator measures market behavior based on the relationship of the close to the open, high and low values of the same bar. A big difference between the high and close on a bar indicates weakness, and wide disparity between the low and close indicates strength. The difference between open and close also indicates market performance.

The True Value of a Bar (TVB) gives an indication of how healthy the market is. A negative close and a positive TVB (or vice versa) is an indication of the market building strength on the opposing side of the trend. The Rex oscillator is a moving average (SMA, EMA, WMA or SMMA) of the TVB value with the specified period.

Interpretation

When the Rex Oscillator turns positive in a bearish trend, a reversal is indicated. Likewise, Rex turning negative in a bull market indicates a reversal to the downside.


Share this

Risk disclosure:

No information on this site is investment advice or a solicitation to buy or sell any financial instrument. Past performance is not indicative of future results. Trading may expose you to risk of loss greater than your deposits and is only suitable for experienced investors who have sufficient financial means to bear such risk.

ProRealTime ITF files and other attachments : How to import ITF files into ProRealTime platform?

PRC is also on YouTube, subscribe to our channel for exclusive content and tutorials

  1. Rollerbob • 01/06/2020 #

    thank you Nicolas !

  2. Guibourse • 01/06/2020 #

    Thanks ! Would it be possible to translate it into a screener ?

avatar
Register or

Likes

avatar avatar avatar avatar avatar avatar avatar
Related users ' posts
adeelq79 Great work Ivan. Thanks
Quino Another really interesting indicator. It works very well on periods below 25. Just a few cos...
MaoRai54 hello, it seems to be very good, but I'm doing intraday and I'm getting very different forec...
Iván Hi! I use this indicator in daily basis. In intraday timeframes, volume changes a lot depend...
sam00075 Accuracy is on point.
Mubin1308 Bonjour à tous, J'ai importé le fichier mais ça ne marche pas, rien qui s'affiche. Pourriez...
hdb1 Thank you so much Ivan..Been using this on 30min timeframe with excellent results. Now my ma...
Iván
8 months ago
Iván Sorry... There is a mistake in line 76. Should be if openday[i]openday[i+1] then
DLVx You do not specify how to read the Calmar ratio. Above 1 is OK and 0 is neutral? Can you she...
lee HI thank you for this indicator. Is it possible to create a screener based on this for when ...
ger h Hola Marc gracias por tus indicadores y la explicacion me puedes decir cual indicador de vol...
xpe74 Hello it seems the file format does not allow to import the file. At importation stage, an e...
Iván You always can copy/paste directly from the post
roccafragius Thank you so much, for my point of view very useful!!!
NicoGB67 Excelente trabajo!!
Jrmjrm Bonsoir est-il possible d'avoir cet indicateur, mais à la place du Wilder Average, utiliser ...
geroniman merci Ivan, super indicatuer. Les cours vont souvent toucher 50% des zones vertes ou rouges....
Iván Pour ajouter une ligne supplémentaire, il suffit de créer une nouvelle variable, par exemple...
Maurizio A. excellent indicateur ! comment puis-je modifier le code pour afficher uniquement les dernier...
Iván Hi! just change line13 for this: showsignals=1
Quino Hi Excellent indicator as usual. Just 2 questions: Why LenH and LenL = 15 as Len could be...
Iván Hi! good question. This is a code request traslation from other platform. I took same inputs...
roccafragius Thank you Ivan, very Useful! I would like translation of Trading View CCI_S Indicator, How ...
Iván hi, you can ask here: https://www.prorealcode.com/free-code-conversion/

Top