

Relative Volatility Intelligent Index
Introduction
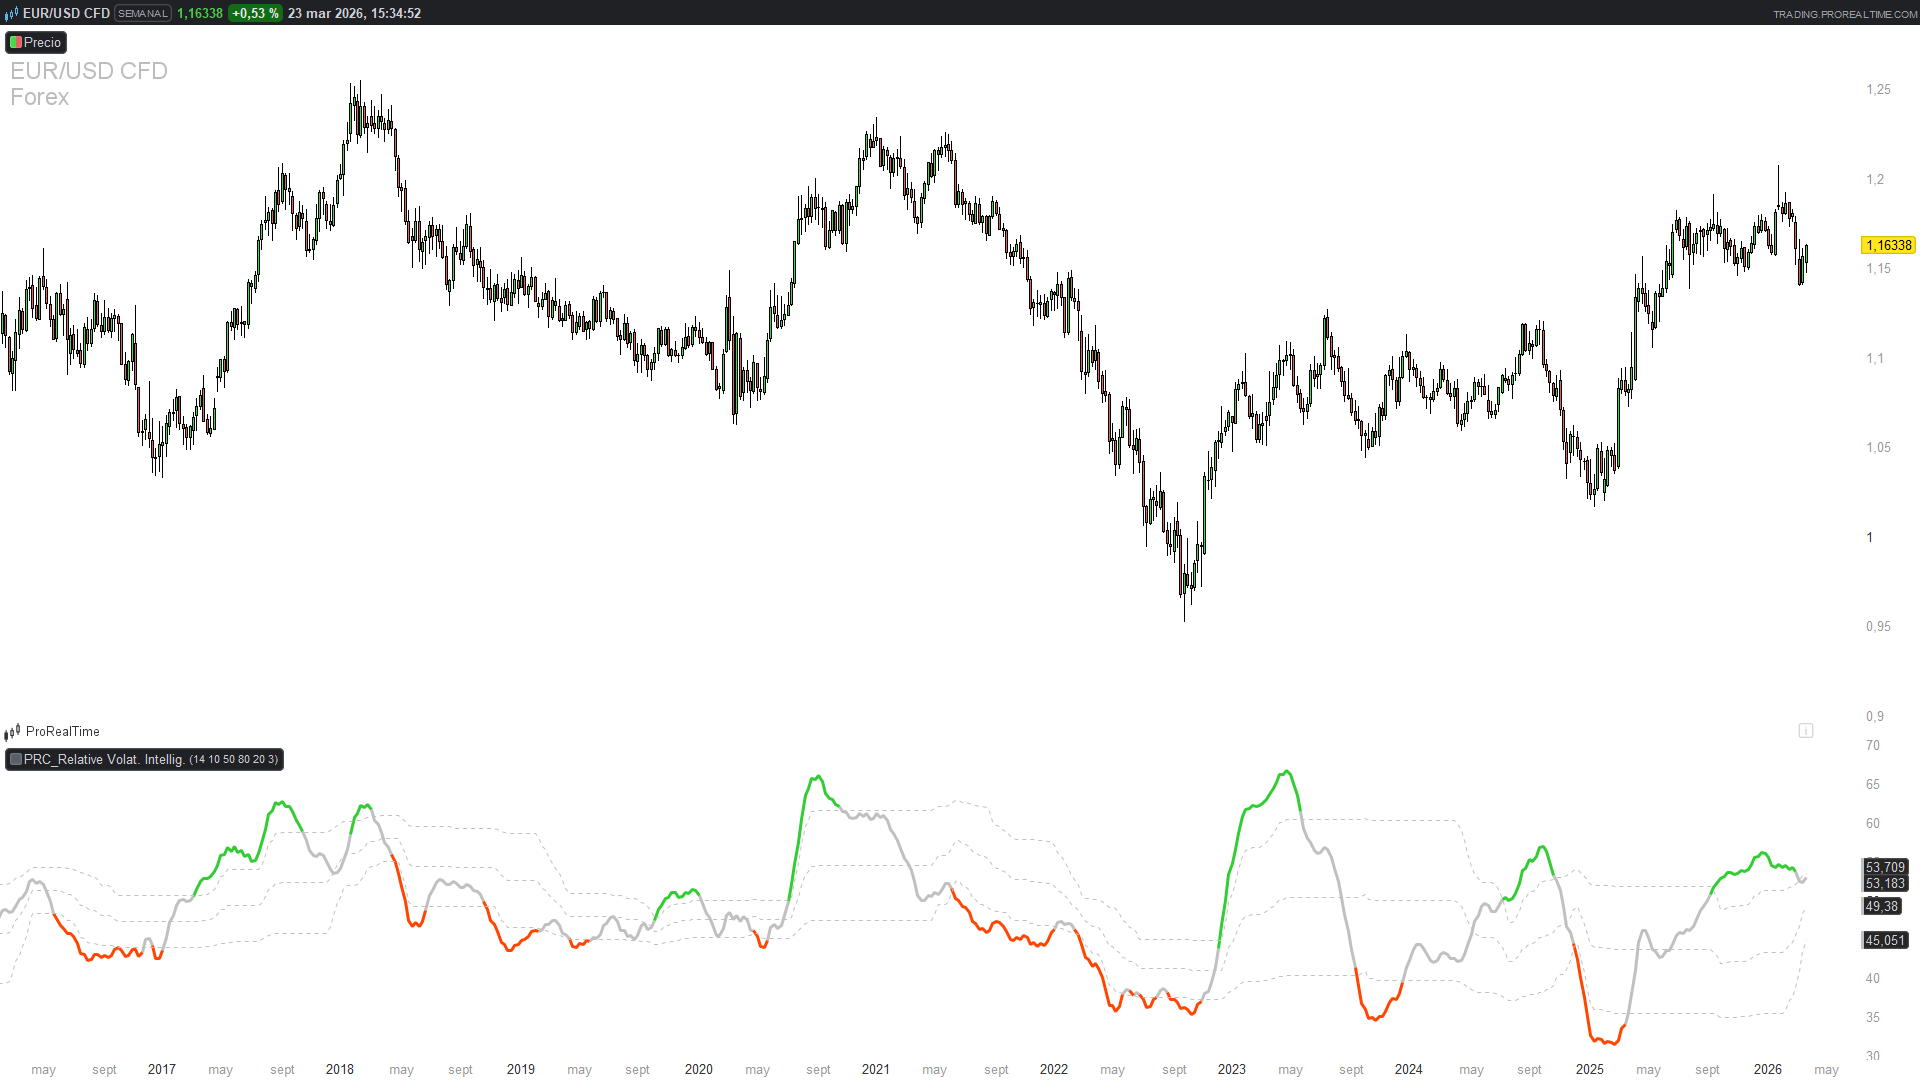
Most volatility indicators tell you how much price is moving, but not where it is heading. The Relative Volatility Intelligent Index (RVII) addresses this by splitting standard deviation into upward and downward components, then expressing their ratio as an oscillator bounded between 0 and 100. When upward volatility dominates, the index rises above 50; when downward volatility takes over, it drops below. The result is a smooth, directional volatility reading that behaves like an RSI — but built entirely on volatility rather than price momentum. Adaptive floating levels replace traditional fixed overbought/oversold thresholds, automatically scaling to the indicator’s recent range for better signal accuracy across different market regimes.
How It Works
The calculation follows four stages.
Stage 1 — Directional volatility split. On each bar, the standard deviation over the chosen period is calculated. If the close is higher than the previous close, the full deviation is assigned to the upward component (uVol) and the downward component (dVol) is set to zero. If the close is lower, the opposite applies. When the close is unchanged, both components are zero. This creates two parallel volatility streams — one tracking expansion on up moves, the other on down moves.
Stage 2 — Wilder smoothing. Each component is smoothed independently using a Wilder moving average (SMMA) over the same period. This produces stable, decayed averages of directional volatility that avoid whipsaw noise from individual bars.
Stage 3 — Ratio and EMA. The raw RVI value is computed as 100 × avgU / (avgU + avgD), yielding a 0–100 oscillator. If both averages are zero (flat market), the value defaults to 50 (neutral). A final EMA smoothing pass removes residual jitter and produces the plotted line.
Stage 4 — Floating levels. When the floating levels lookback is greater than zero, the indicator calculates the highest and lowest values of the smoothed RVI over that lookback window. The upper and lower thresholds are then mapped proportionally within this range using the zoneUp and zoneDown percentages. This means the overbought/oversold bands contract and expand with the indicator itself, adapting to trending vs. ranging conditions. When the lookback is set to zero, the zones revert to fixed horizontal levels.
Color Modes
The indicator offers three coloring strategies, selectable via the colorMode parameter.
Mode 1 — Slope. The line turns green when the current value is higher than the previous bar (rising volatility momentum), red when lower, and gray when flat. This is the most responsive mode — useful for catching early shifts in volatility direction, but prone to noise in choppy markets.
Mode 2 — Middle cross. Green above the midpoint between upper and lower levels, red below. This filters out minor oscillations and focuses on which side of the equilibrium volatility currently sits. A good general-purpose setting.
Mode 3 — Level cross. Green when the indicator breaks above the upper level (strong bullish volatility), red when it drops below the lower level (strong bearish volatility), gray in between. The most selective mode — it only colors the line during confirmed directional volatility extremes. Best used with floating levels enabled for adaptive thresholds.
Parameters
volPeriod (default 14) — lookback period for both the standard deviation calculation and the Wilder smoothing. Higher values produce a slower, more stable reading.
volSmooth (default 10) — period of the final EMA applied to the raw RVI ratio. Increase for a smoother line, decrease for faster response.
flPeriod (default 50) — lookback window for floating levels. Set to 0 to use fixed overbought/oversold thresholds instead. Higher values make the adaptive bands slower to adjust.
zoneUp (default 80) — upper threshold expressed as a percentage of the floating range (or as a fixed level when flPeriod = 0).
zoneDown (default 20) — lower threshold, same logic as zoneUp.
colorMode (default 3) — coloring strategy: 1 = slope, 2 = middle cross, 3 = level cross.
How to Read the Indicator
The RVII oscillates around 50. Sustained readings above 50 indicate that upward volatility is stronger than downward — price tends to rise in these conditions. Readings below 50 reflect bearish volatility dominance. The further the line moves from 50, the stronger the directional conviction.
The floating levels act as a context filter. When the line crosses above the upper floating level, it signals that bullish volatility is extreme relative to recent history — not just high in absolute terms. Conversely, a drop below the lower floating level flags extreme bearish volatility. The zone between the two levels represents a neutral area where no clear directional bias exists.
For practical use, consider the following approaches. Use level cross mode (colorMode 3) with floating levels as a trend filter: enter long positions only when the line is green (above upper level), and short positions only when red (below lower level). Alternatively, use middle cross mode (colorMode 2) as a confirmation layer alongside a momentum or trend-following indicator — the RVII confirms whether volatility supports the direction of the trade. Slope mode (colorMode 1) works best for short-term traders who need early warnings of volatility shifts, accepting higher noise in exchange for speed.
The indicator works on any timeframe and any instrument. On lower timeframes, consider increasing volSmooth to reduce choppiness. On higher timeframes, the default parameters generally perform well.
ProBuilder Code
//--------------------------------------------
// PRC_Relative Volatility Intelligent Index (from MT5 by mladen)
// version = 0
// 12.03.2026
// Iván González @ www.prorealcode.com
// Sharing ProRealTime knowledge
//--------------------------------------------
// Parameters:
//   volPeriod   = StdDev and Wilder averaging period (14)
//   volSmooth   = Final EMA smoothing period (10)
//   flPeriod    = Floating levels lookback (50), 0 = fixed levels
//   zoneUp      = Upper zone (80), zoneDown = Lower zone (20)
//   colorMode   = 1: slope, 2: middle cross, 3: level cross
//--------------------------------------------
// --- Parameters ---
//--------------------------------------------
volPeriod = 14
volSmooth = 10
flPeriod = 50
zoneUp = 80
zoneDown = 20
colorMode = 3
//--------------------------------------------
// --- Source ---
//--------------------------------------------
src = close
//--------------------------------------------
// --- Standard Deviation ---
//--------------------------------------------
dev = STD[volPeriod](src)
//--------------------------------------------
// --- Directional volatility split ---
//--------------------------------------------
IF barindex > 0 THEN
   IF src > src[1] THEN
      uVol = dev
      dVol = 0
   ELSIF src < src[1] THEN
      uVol = 0
      dVol = dev
   ELSE
      uVol = 0
      dVol = 0
   ENDIF
ELSE
   uVol = 0
   dVol = 0
ENDIF
//--------------------------------------------
// --- Wilder (SMMA) averaging of each side ---
//--------------------------------------------
avgU = WilderAverage[volPeriod](uVol)
avgD = WilderAverage[volPeriod](dVol)
//--------------------------------------------
// --- RVI raw: ratio 0-100 ---
//--------------------------------------------
IF (avgU + avgD) <> 0 THEN
   rviRaw = 100 * avgU / (avgU + avgD)
ELSE
   rviRaw = 50
ENDIF
//--------------------------------------------
// --- Final EMA smoothing ---
//--------------------------------------------
rviSmooth = ExponentialAverage[volSmooth](rviRaw)
//--------------------------------------------
// --- Floating levels (dynamic OB/OS) ---
// When flPeriod > 0: scale zoneUp/zoneDown within the recent RVI range
// When flPeriod = 0: use zoneUp/zoneDown as fixed values
//--------------------------------------------
IF flPeriod > 0 THEN
   hiRvi = highest[flPeriod](rviSmooth)
   loRvi = lowest[flPeriod](rviSmooth)
   levUp = loRvi + (hiRvi - loRvi) * zoneUp / 100
   levDn = loRvi + (levUp - loRvi) * zoneDown / 100
ELSE
   levUp = zoneUp
   levDn = zoneDown
ENDIF

levMid = (levUp + levDn) / 2
//--------------------------------------------
// --- Trend detection (3 modes) ---
//--------------------------------------------
IF colorMode = 3 THEN
   // Level cross: colored above upper / below lower, neutral between
   IF rviSmooth > levUp THEN
      trd = 1
   ELSIF rviSmooth < levDn THEN
      trd = -1
   ELSE
      trd = 0
   ENDIF
ELSIF colorMode = 2 THEN
   // Middle line cross
   IF rviSmooth > levMid THEN
      trd = 1
   ELSIF rviSmooth < levMid THEN
      trd = -1
   ELSE
      trd = 0
   ENDIF
ELSE
   // Slope change
   IF rviSmooth > rviSmooth[1] THEN
      trd = 1
   ELSIF rviSmooth < rviSmooth[1] THEN
      trd = -1
   ELSE
      trd = 0
   ENDIF
ENDIF
//--------------------------------------------
// --- Colors: green=bullish, red=bearish, gray=neutral ---
//--------------------------------------------
IF trd = 1 THEN
   // LimeGreen
   rr = 50
   gg = 205
   bb = 50
ELSIF trd = -1 THEN
   // OrangeRed
   rr = 255
   gg = 69
   bb = 0
ELSE
   // Neutral silver
   rr = 192
   gg = 192
   bb = 192
ENDIF
//--------------------------------------------
RETURN rviSmooth COLOURED(rr, gg, bb) style(line, 3) AS "RVII", levUp COLOURED(192, 192, 192) style(dottedline, 1) AS "Upper", levMid COLOURED(192, 192, 192) style(dottedline, 1) AS "Middle", levDn COLOURED(192, 192, 192) style(dottedline, 1) AS "Lower"
