

Relative Trend Index (RTI)
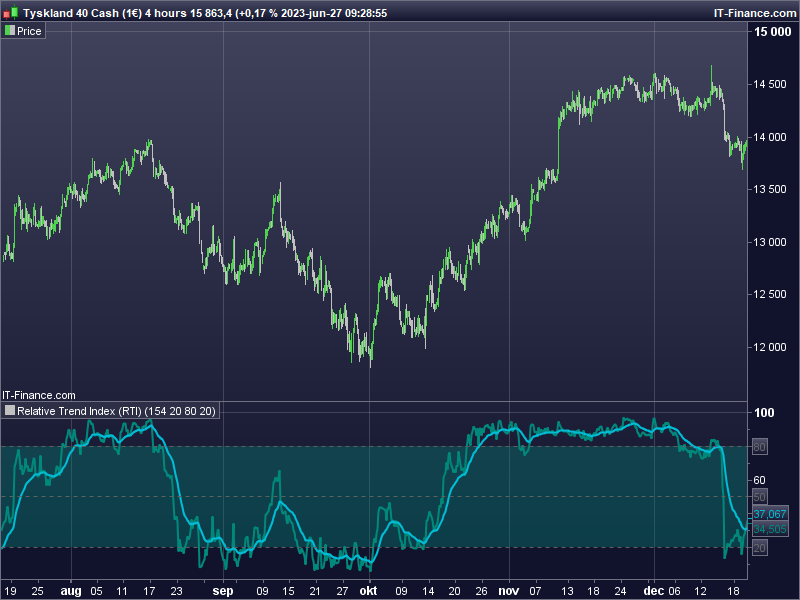
Zeiierman Trading developed the Relative Trend Index (RTI) which is a technical analysis tool that accurately identifies the direction and strength of market trends. It stands out from conventional indicators by its ability to swiftly and effectively respond to market volatility while minimizing the impact of short-term fluctuations. The RTI merges trend-following and mean-reverting qualities, and its user-friendly approach to trend strength makes it a valuable and distinctive indicator that is highly responsive to price action.
Calculations
In summary, while simple enough, the math behind the RTI indicator is quite powerful. It combines the quantification of price volatility with the flexibility to adjust the trend sensitivity. It provides a normalized output that can be interpreted consistently across various trading scenarios.
The Relative Trend Index (RTI) indicator’s mathematical foundation is based on key statistical concepts such as Standard Deviation and Percentiles. However, the current PRT version doesn’t utilize percentiles and instead utilizes the highest and lowest values over the trend length for its calculation.
Code:
// Relative Trend Index by Zeiierman
// RTI by Zeiierman
// This work is licensed under a Attribution-NonCommercial-ShareAlike 4.0 International (CC BY-NC-SA 4.0) https://creativecommons.org/licenses/by-nc-sa/4.0/
// © Zeiierman
// © Zeiierman Trading

// Inputs
TrendLength  = 100
SignalLength = 20

//Stddev // You can use the inbuilt function as well.
p=20
IF barindex >= p-1 THEN
sumy2 = 0
sumy = 0
FOR i = 0 TO p-1 do
sumy2 = sumy2 + SQUARE(close[i])
sumy = sumy + close[i]
NEXT
STDDEV =SQRT(sumy2 / p - SQUARE(sumy / p))
ELSE
STDDEV = undefined
ENDIF


// Calculate upper and lower trend
uppertrend = close + STDDEV
lowertrend = close - STDDEV

// Get trend values
UpperTrendHigh = (Highest[TrendLength] (uppertrend))
LowerTrendLow = (Lowest[TrendLength] (lowertrend))

// Relative Trend Index Calculation
RelativeTrendIndex = ((close - LowerTrendLow) / (UpperTrendHigh - LowerTrendLow)) * 100


// MA of Relative Trend Index
MARelativeTrendIndex = exponentialaverage[SignalLength](RelativeTrendIndex)


// Plots
colorbetween(OB,OS, 0,137,123,90)


return RelativeTrendIndex as "Relative Trend Index (RTI)" COLOURED(0,137,123), MARelativeTrendIndex as "MA Relative Trend Index" COLOURED(0,188,212), 50 as "MID" COLOURED(96,96,96) STYLE(DOTTEDLINE,1), OB as "OB" COLOURED(96,96,96) STYLE(DOTTEDLINE,1), OS as "OS" COLOURED(96,96,96) STYLE(DOTTEDLINE,1)