

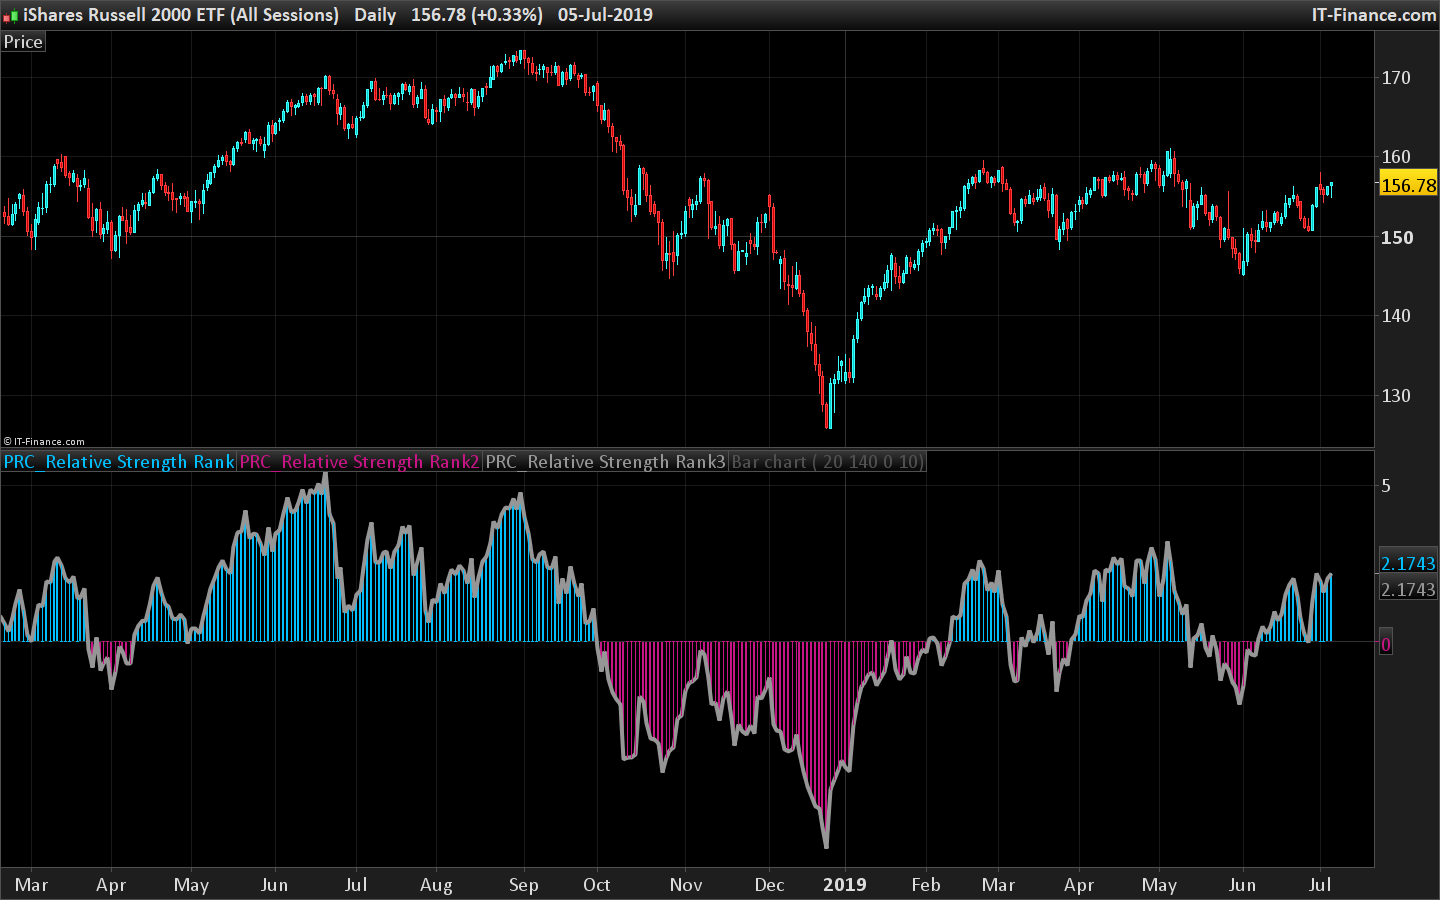
Relative Strength Rank Indicator
This indicator is a ranking tool used to compare a group of stocks, ETFs or futures contracts to determine which specific instrument is performing best. The indicator creates a score based upon the symbols historical price movement. You can then compare this score to the other RS Rank scores of other stocks or ETFs in your basket of trading instruments. Thus, you can simply pick the instrument with the highest RS Rank score when creating a momentum based trading system.
The RS Rank is computed by taking the average of a long-term price change with a short term price change. This average is then divided by the 10-day Average True Range. This will produce a ranking score which can be compared to other instruments.
//PRC_Relative Strength Rank | indicator
//08.07.2019
//Nicolas @ www.prorealcode.com
//Sharing ProRealTime knowledge

// --- settings
RsrShortPeriod = 20
RsrLongPeriod  = 140
RsrMaMode      = 0 //MA type
AtrPeriod      = 10
// --- end of settings

RsrPrice       = customclose

price = average[1](RsrPrice)
mas   = average[RsrShortPeriod,RsrMaMode](RsrPrice)
mal   = average[RsrLongPeriod,RsrMaMode](RsrPrice)
atr   = averagetruerange[AtrPeriod]
if (atr<>0) then
 rsr = (price-mas+price-mal)/(2.0*atr)
else
 rsr = 0
endif

slope = slope[1]
if (rsr>rsr[1]) then
 slope =  1
endif
if (rsr<rsr[1]) then
 slope = -1
endif

rsrhuu=0
if (rsr>0) then
 if slope=1 then
  rsrHuu = rsr
 else
  drawbarchart(0,rsr,0,0) coloured(0,191,255)
 endif
endif

rsrhdd=0
if (rsr<0) then
 if (slope=-1) then
  rsrHdd = rsr
 else
  drawbarchart(0,0,rsr,0) coloured(199,21,133)
 endif
endif

return rsrhuu coloured(0,191,255) style(histogram), rsrhdd coloured(199,21,133) style(histogram), rsr coloured(150,150,150) style(line,4)