

Relative Momentum Index (RMI)
The Relative Momentum Index was developed by Roger Altman and was introduced in his article in the February, 1993 issue of Technical Analysis of Stocks & Commodities magazine.
Altman’s describe his indicator in this way :
“the RSI is modified by counting up and down days starting from today’s close relative to the close Y days ago, where Y is not necessarily 1 as required by the RSI. The RSI is released from the arbitrary restriction of comparing consecutive days for price changes” changing the period to 20 days, but with Y set at 5 instead of 1 makes it “easier to anticipate tradable reversal points compared with the one-parameter RSI. This modification is called the relative momentum index (RMI), in which momentum is substituted for strength, because a momentum index is usually obtained by creating a moving average of the most recent closing price compared with the close Y days in the past.”
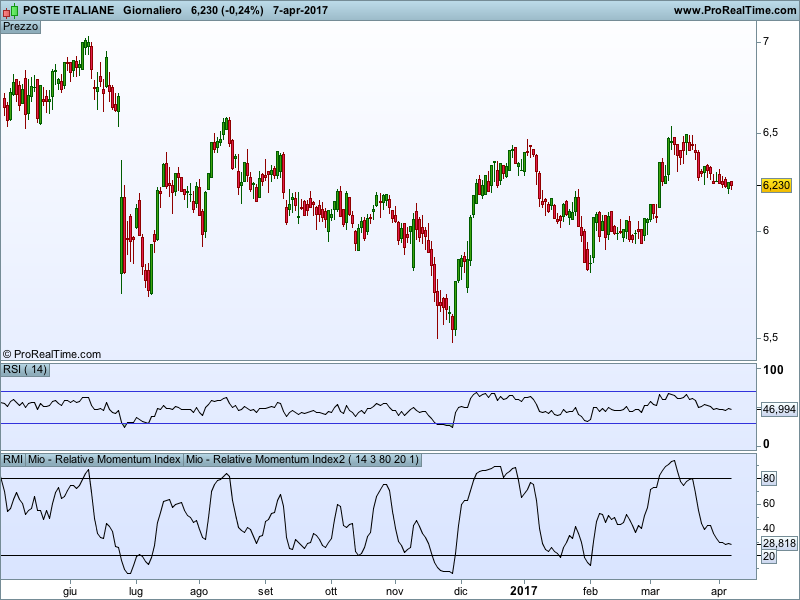
I personally use both RSI (14 period) and RMI (20,5, with Exponential moving average). I find that RSI is better in showing divergences while RMI is better is pointing out overbought/oversold areas.
Blue skies
// inputs
//Period = 20
//Lookback = 3
//ob = 70
//os = 20

//calc
momup=max(close-close[lookback],0)
momdown=max(close[lookback]-close,0)

up = average[period,mm](momup)
dn = average[period,mm](momdown)

rm=up/dn

rmi = 100*rm/(1+rm)

return rmi as "RMI", ob,os