

Regression & Statistical BANDS (Log-Normal) v2
REGRESION & STATISTICAL BANDS
Ver. 2.00 (Log-Normal) by @Xel_Arjona
CHANGES:
- This version could be treated not so much as an update but rather an election over 1.00.a given that the Array field (y axis or price) now is computed as in Logiarithmic scale to catch better moves over penny prices. If you’r an statistical puritan that like to compute deviations and errors over “Normal Distribution” and only use Log-normal calculation’s for returns, you could still use 1.00.a.
- Raw Linear Regression has been supplanted with Time Series Forecast (TSF), which only adds the slope factor to the LinearRegression EndPoint (curve).
Intro:
This is an approach to get in one single indicator one of the best of both mathematical worlds:
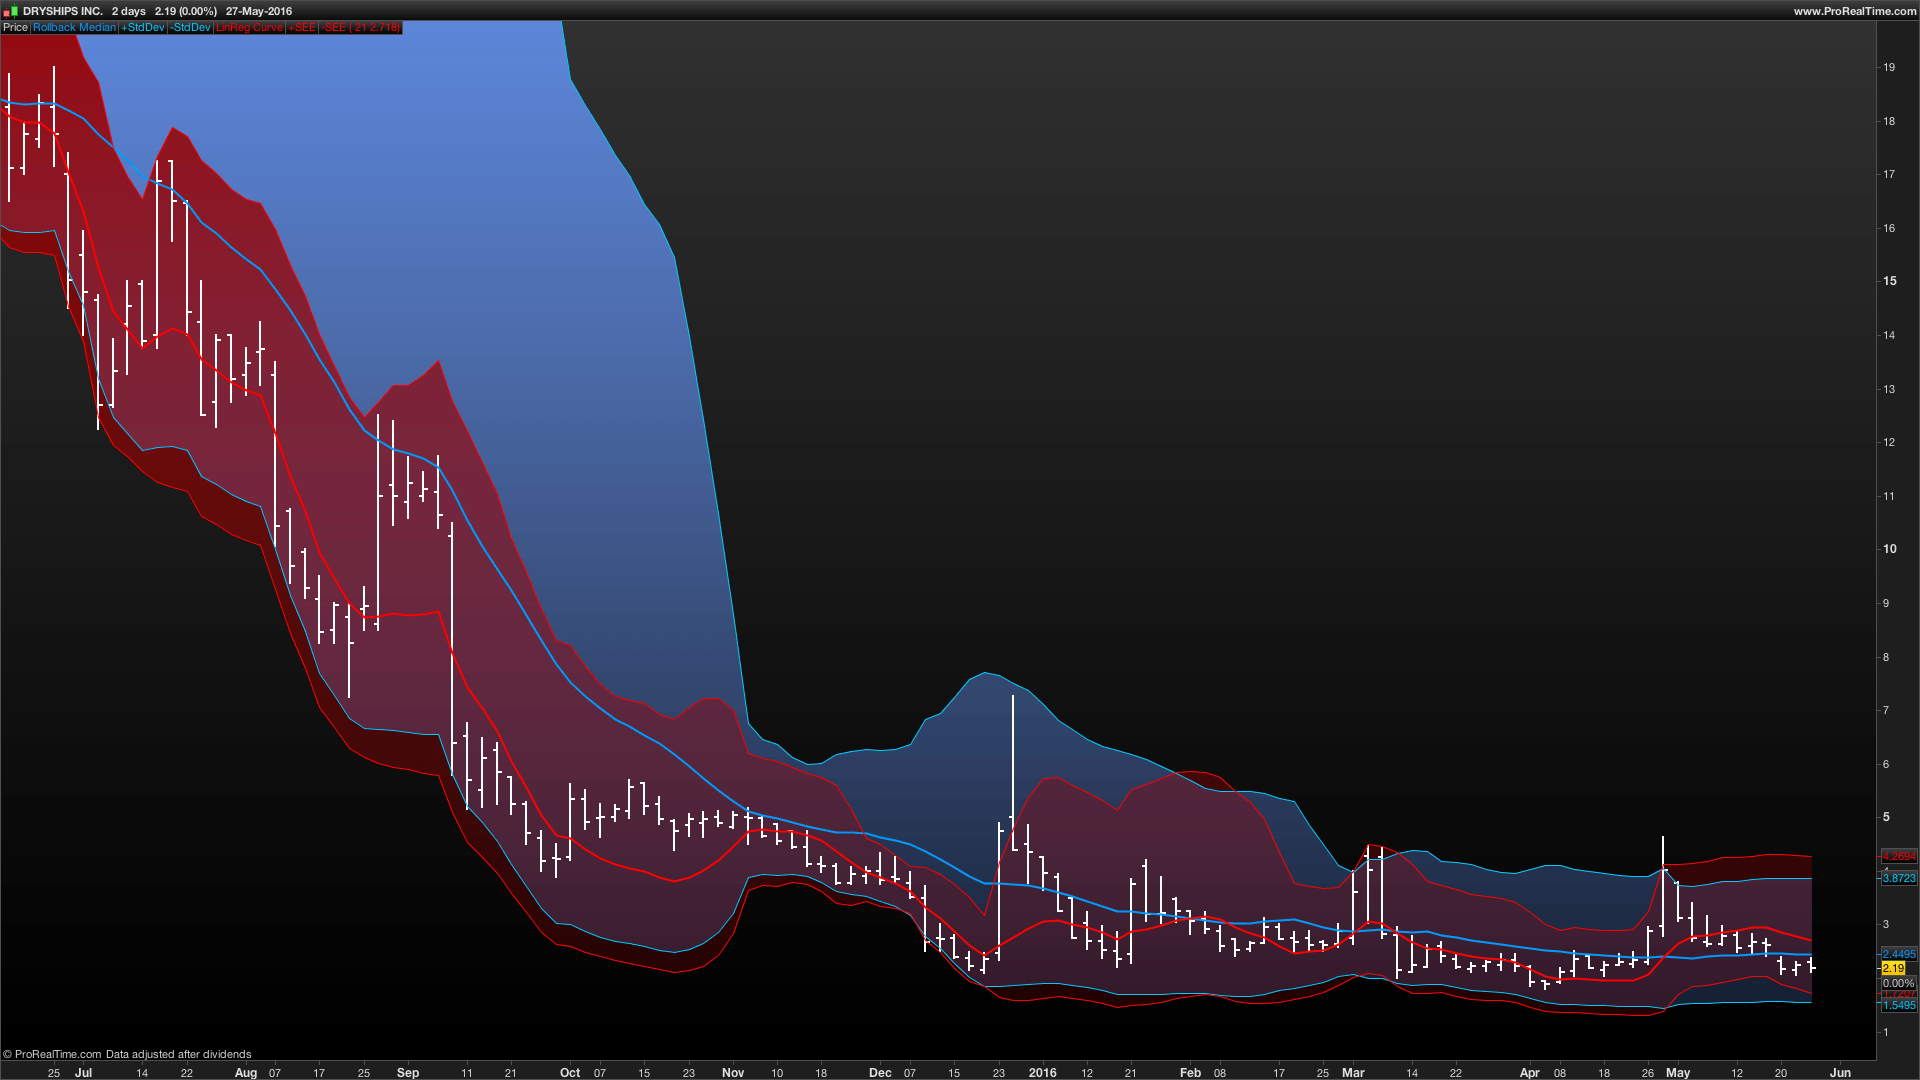
From within the STATISTICAL side, everybody well konwn the wide use of the Standard Deviation with a Multiplier Factor from within a Rolling Back MEDIAN (Simple Moving Average) best known as the famous and widly used “Bollinger Band”.
From within the REGRESSION ANALYSIS side, the relevant importance of the STANDARD ERROR with a Multiplier Factor from within an OrdinaryLeastSquares curve generated from the last rolling back sample of the series. For this purpose, a well documented indicator has been posted.
Both indicators are in sync from a uniquie Rolling Back Period window. At this approach, the Regression Analysis tend to “catch” faster moves and volatility while the Statistical band is perfect for mid to long term move confirmation.
Feel free to improve this indicator at www.prorealcode.com.
// REGRESSION & STATISTICAL BANDS (Log-Normal)

AR = LOG(close)
N = barindex
TSF = linearregression[P](AR) + linearregressionslope[P](AR)
M = Average[P](AR)
MP = EXP(M)
TSFP = EXP(TSF)

// BETA
bv1 = summation[P](N*AR) - (P*Average[P](N)*Average[P](AR))
bv2 = summation[P](square(N)) - (P*square(Average[P](N)))
CalcB = bv1/bv2
// ALPHA
CalcA = Average[P](AR) - (CalcB*Average[P](N))

// STANDARD ERROR OF THE ESTIMATE
sev1 = Summation[P](square(AR)) - (CalcA*Summation[P](AR)) - (CalcB*Summation[P](N*AR))
sev2 = P - 2
SEE = sqrt(sev1/sev2)

// BANDS
SeUB = EXP(TSF + (SEE*MF))
SeBB = EXP(TSF - (SEE*MF))
BoUB = EXP(M + (STD[P](AR)*MF))
BoBB = EXP(M - (STD[P](AR)*MF))

// OUTPUT
RETURN MP AS "Rollback Median", BoUB AS "+StdDev", BoBB AS "-StdDev", TSFP AS "LinReg Curve", SeUB AS "+SEE", SeBB AS "-SEE"
Cheers!